Download Trends in U.S. Corrections and more Study Guides, Projects, Research Community Corrections in PDF only on Docsity!
Trends in U.S. Corrections
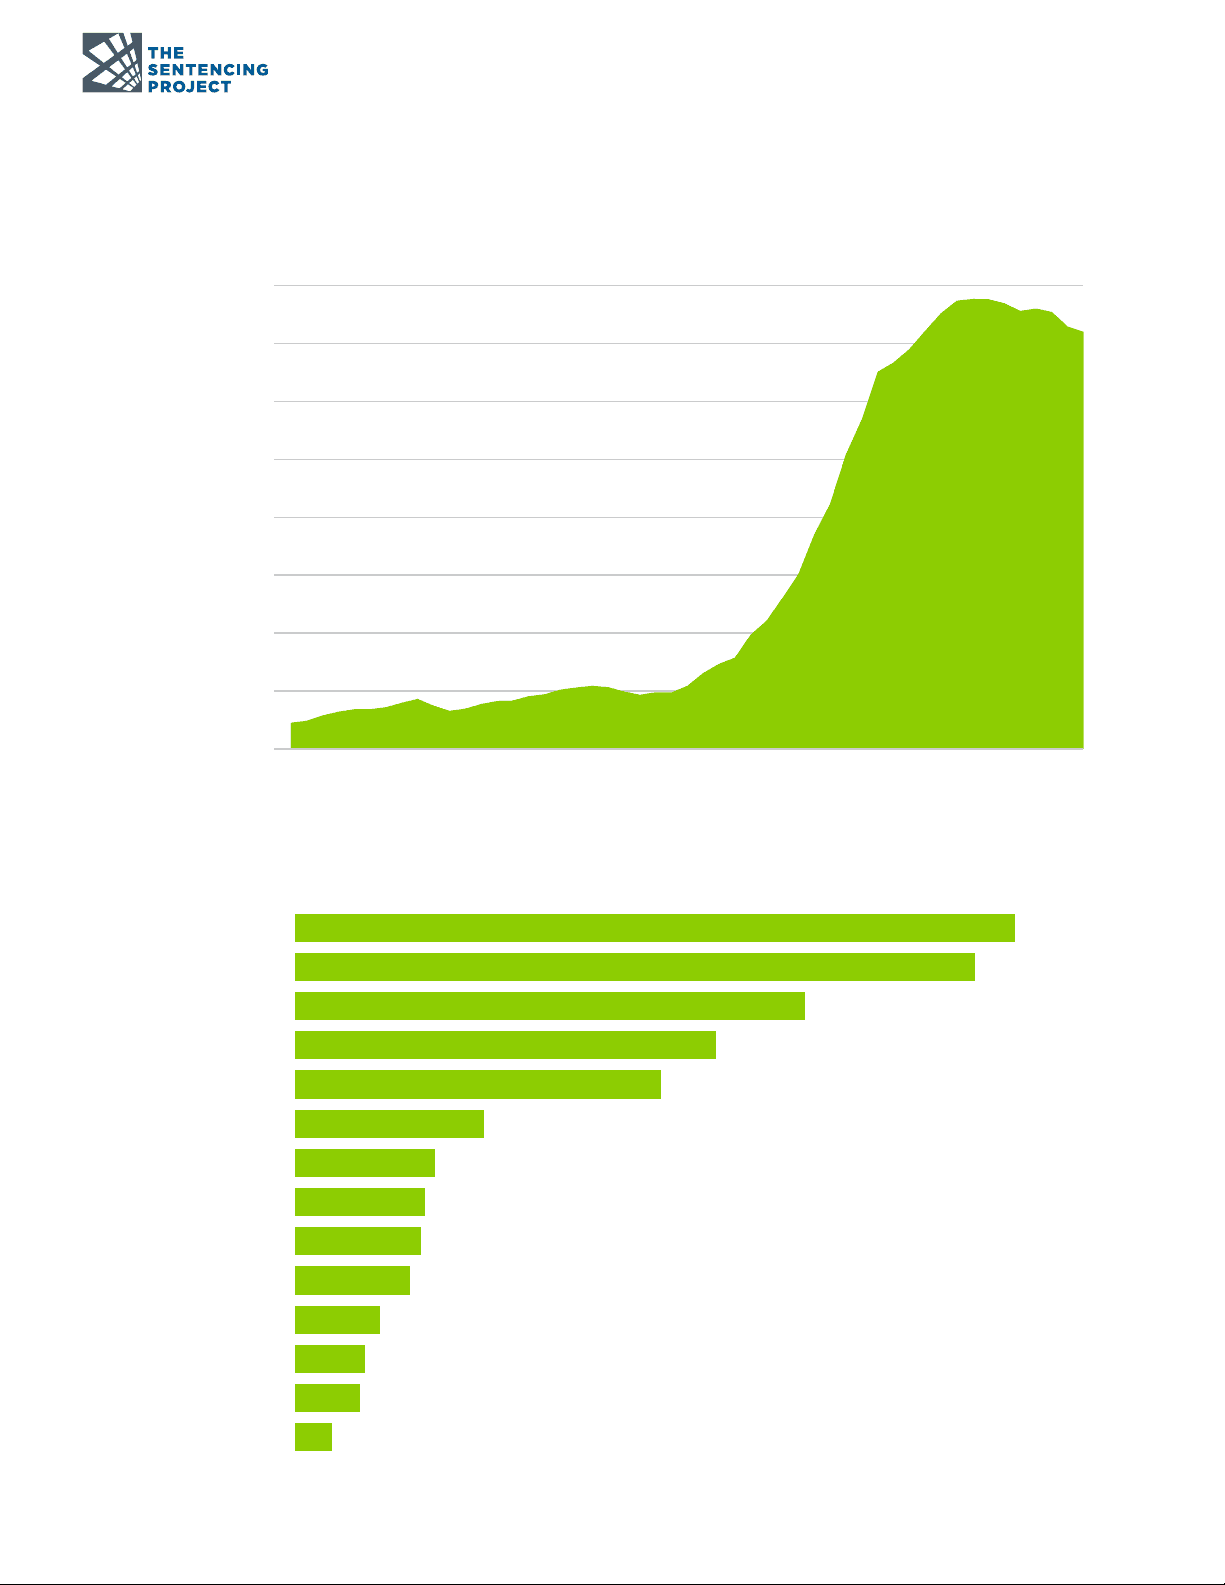
U.S. State and Federal Prison Population, 1925-
Source: Bureau of Justice Statistics Prisoners Series.
International Rates of Incarceration per 100,
Source: Walmsley, R. (2019). World Prison Brief. London: Institute for Criminal Policy Research. Available online: http://www. prisonstudies.org/world-prison-brief
2017: 1,439,
0
200,
400,
600,
800,
1,000,
1,200,
1,400,
1,600,
19251928193219361940194419481952195619601964196819721976198019841988199219962000200420082010201220142017
Number of People
India
Sweden
Denmark
Germany
France
Canada
China
Spain
Australia
Brazil
Russia
Rwanda
El Salvador
United States (^655)
State Expenditures on Corrections in Billions,
Source: National Association of State Budget Officers (1985-2017). State Expenditure Report Series. Washington, DC: National Association of State Budget Officers.
Population Under Control of the U.S. Corrections System, 1980 and 2016
Sources: Kaeble, D. and Cowhig, M. (2018). Correctional Populations in the United States, 2016. Washington, DC: Bureau of Justice Statistics. Key Statistics: Total Correctional Population. Washington, DC: Bureau of Justice Statistics. Totals adjust for individuals with multiple correctional statuses to prevent double counting.
MASS INCARCERATION
The United States is the world's leader in incarceration with 2.2 million people currently in the nation's prisons and jails — a 500% increase over the last forty years. Changes in sentencing law and policy, not changes in crime rates, explain most of this increase. These trends have resulted in prison overcrowding and fiscal burdens on states to accommodate a rapidly expanding penal system, despite increasing evidence that large-scale incarceration is not an effective means of achieving public safety.
State & Federal Prison Population by Offense
Source: Bronson, J. and Carson E.A. (2019). Prisoners in 2017. Washington, D.C.: Bureau of Justice Statistics.
1980: 1,842,100 individuals 2016: 6,613,500 individuals
1985 1990 1995 2000 2005 2010 2017
Other
Public Order
Property
Drug
Violent
Weapons Other
7.9%
47.3%
5.9%
38.5%
0.4%
Federal (2017) State (2016)
55.2%
14.8%
17.5%
1 1.9%
0.6%
Immigration
6.7% 17.0% (^) 14.0%
Prison Jail Parole Probation
319,
1,505,
182,
740,
220,
874,
1,118,
3,673,
Highest and Lowest State Incarceration Rates (per 100,000), 2017
Source: Bronson, J. and Carson, E.A. (2019). Prisoners in 2017. Washington, DC: Bureau of Justice Statistics.
WOMEN
The number of women in prison has been increasing at twice the rate of growth for men since
- Women in prison often have significant histories of physical and sexual abuse, high rates of HIV, and substance abuse problems. Women’s imprisonment in female- led households leads to children who suffer from their mother’s absence and breaks in family ties.
Number of Women in State and Federal Prisons, 1980-
Sources: Bureau of Justice Statistics Prisoners Series; Minor-Harper, S. (1986). State and Federal Prisoners, 1925-1985. Washington, DC: Bureau of Justice Statistics.
Overall (All States = 390)
State Rate HIGHEST Louisiana 719 Oklahoma 704 Mississippi 619 Arkansas 598 Arizona 569 LOWEST Massachusetts 120 Maine 134 Rhode Island 170 Vermont 180 Minnesota 191
Women (All States = 57)
State Rate HIGHEST Oklahoma 157 Kentucky 133 South Dakota 124 Idaho 114 Missouri 109 LOWEST Massachusetts 9 Rhode Island 13 New Jersey 17 New York 22 Maine 22
Men (All States = 733)
State Rate HIGHEST Louisiana 1, Oklahoma 1, Mississippi 1, Arkansas 1, Arizona 1, LOWEST Massachusetts 239 Maine 250 Vermont 331 Rhode Island 337 Minnesota 357
11 1,
13,
21,
44,
68,
93,
107,
1 12,
Lifetime Likelihood of Imprisonment of U.S. Residents Born in 2001
Source: Bonczar, T. (2003). Prevalence of Imprisonment in the U.S. Population, 1974-2001. Washington, DC: Bureau of Justice Statistics.
Rate of Imprisonment per 100,000, by Gender, Race, and Ethnicity, 2017
Source: Bronson J. and Carson, E.A. (2019). Prisoners in 2017. Washington, DC: Bureau of Justice Statistics.
People in State and Federal Prisons, by Race and
Ethnicity, 2017
Source: Bronson J. and Carson, E.A. (2019). Prisoners in 2017. Washington, DC: Bureau of Justice Statistics.
RACIAL DISPARITIES
More than 60% of the people in prison today are people of color. Black men are six times as likely to be incarcerated as white men and Hispanic men are 2.7 times as likely. For black men in their thirties, about 1 in every 12 is in prison or jail on any given day. Other
Hispanic
Black
White 436,
475,
336,
190,
30.3%
33.1%
23.4%
13.3%
Black men
Black women
White women
Latina women
White men
Latino men
White Women Black Women Latina Women
White Men Black Men Latino Men
1 in 1 11 1 in 18 1 in 45
1 in 17 1 in 3 1 in 6
All Women
1 in 56
All Men
1 in 9
In 48 states, a felony conviction can result in the loss of an individual’s voting rights. The period of disenfranchisement varies by state, with some states restoring the vote upon completion of a prison term, and others effectively disenfranchising for life. As a result of the dramatic expansion of the criminal justice system in the last 40 years, felony disenfranchisement has affected the political voice of many communities. As of 2016, 6.1 million Americans were unable to vote due to state felony disenfranchisement policies.
FELONY
DISENFRANCHISEMENT
No restriction (^) Prison Prison & parole Prison, parole & probation
Prison, parole, probation & post-sentence
Felony Disenfranchisement Restrictions by State, 2016
Disenfranchised Population by Incarceration Status, 2016
Source: Chung, J. (2016). Felony Disenfranchisement: A Primer. Washington, DC: The Sentencing Project.
Source: Uggen, C., Larson, R., & Shannon, S. (2016). 6 Million Lost Voters: State-Level Estimates of Felon Disenfranchisement, 2016. Washington, DC: The Sentencing Project.
Rate of Disenfranchisement, by Race, 2016
Source: Uggen, C., Larson, R., & Shannon, S. (2016). 6 Million Lost Voters: State-Level Estimates of Felon Disenfranchisement, 2016. Washington, DC: The Sentencing Project.
African American
Non-African American 2.47%
Completed sentence
On probation or parole
In prison or jail 23%
The Sentencing Project • 1705 DeSales Street NW, 8th Floor • Washington, D.C. 20036 • sentencingproject.org 8 8
This fact sheet was updated June 2019.
The Sentencing Project works for a fair and effective U.S. justice system by promoting reforms in sentencing policy, addressing unjust racial disparities and practices, and advocating for 1705 DeSales Street NW, 8th Floor alternatives to incarceration. Washington, D.C. 20036
sentencingproject.org
The number of people serving life sentences continues to grow even while serious, violent crime has been declining for the past 20 years and little public safety benefit has been demonstrated to correlate with increasingly lengthy sentences. The lifer population has nearly quintupled since 1984. One in nine people in prison is now serving a life sentence and nearly a third of lifers have been sentenced to life without parole.
Number of People Serving Life Sentences,
Number of People Serving Life
Without Parole Sentences, 1992-
LIFE SENTENCES
1992 2003 2008 2012 2016
12,
33,
40,
49,081 53,
1984 1992 2003 2005 2008 2012 2016
34,
69,
127,677 132,
142,
157,966 161,
Ohio
Georgia
New York
Florida
California 39,
13,
9,
8,
6,
Life without parole
All life sentences
Source: Nellis, A. (2016). Still Life: America’s Increasing Use of Life and Long-Term Sentences. Washington, DC: The Sentencing Project.
States with the Most People Serving Life Sentences, 2016