

Study with the several resources on Docsity

Earn points by helping other students or get them with a premium plan


Prepare for your exams
Study with the several resources on Docsity

Earn points to download
Earn points by helping other students or get them with a premium plan
Community
Ask the community for help and clear up your study doubts
Discover the best universities in your country according to Docsity users
Free resources
Download our free guides on studying techniques, anxiety management strategies, and thesis advice from Docsity tutors
A comprehensive set of quiz questions and answers covering various chapters of the ssgi sixsigma green belt curriculum. It includes questions on topics such as sipoc diagrams, kanban, value stream mapping, lean principles, standard deviation, control charts, and alpha and beta errors. Designed to help students prepare for exams and gain a deeper understanding of six sigma concepts.
Typology: Exams
1 / 26

This page cannot be seen from the preview
Don't miss anything!


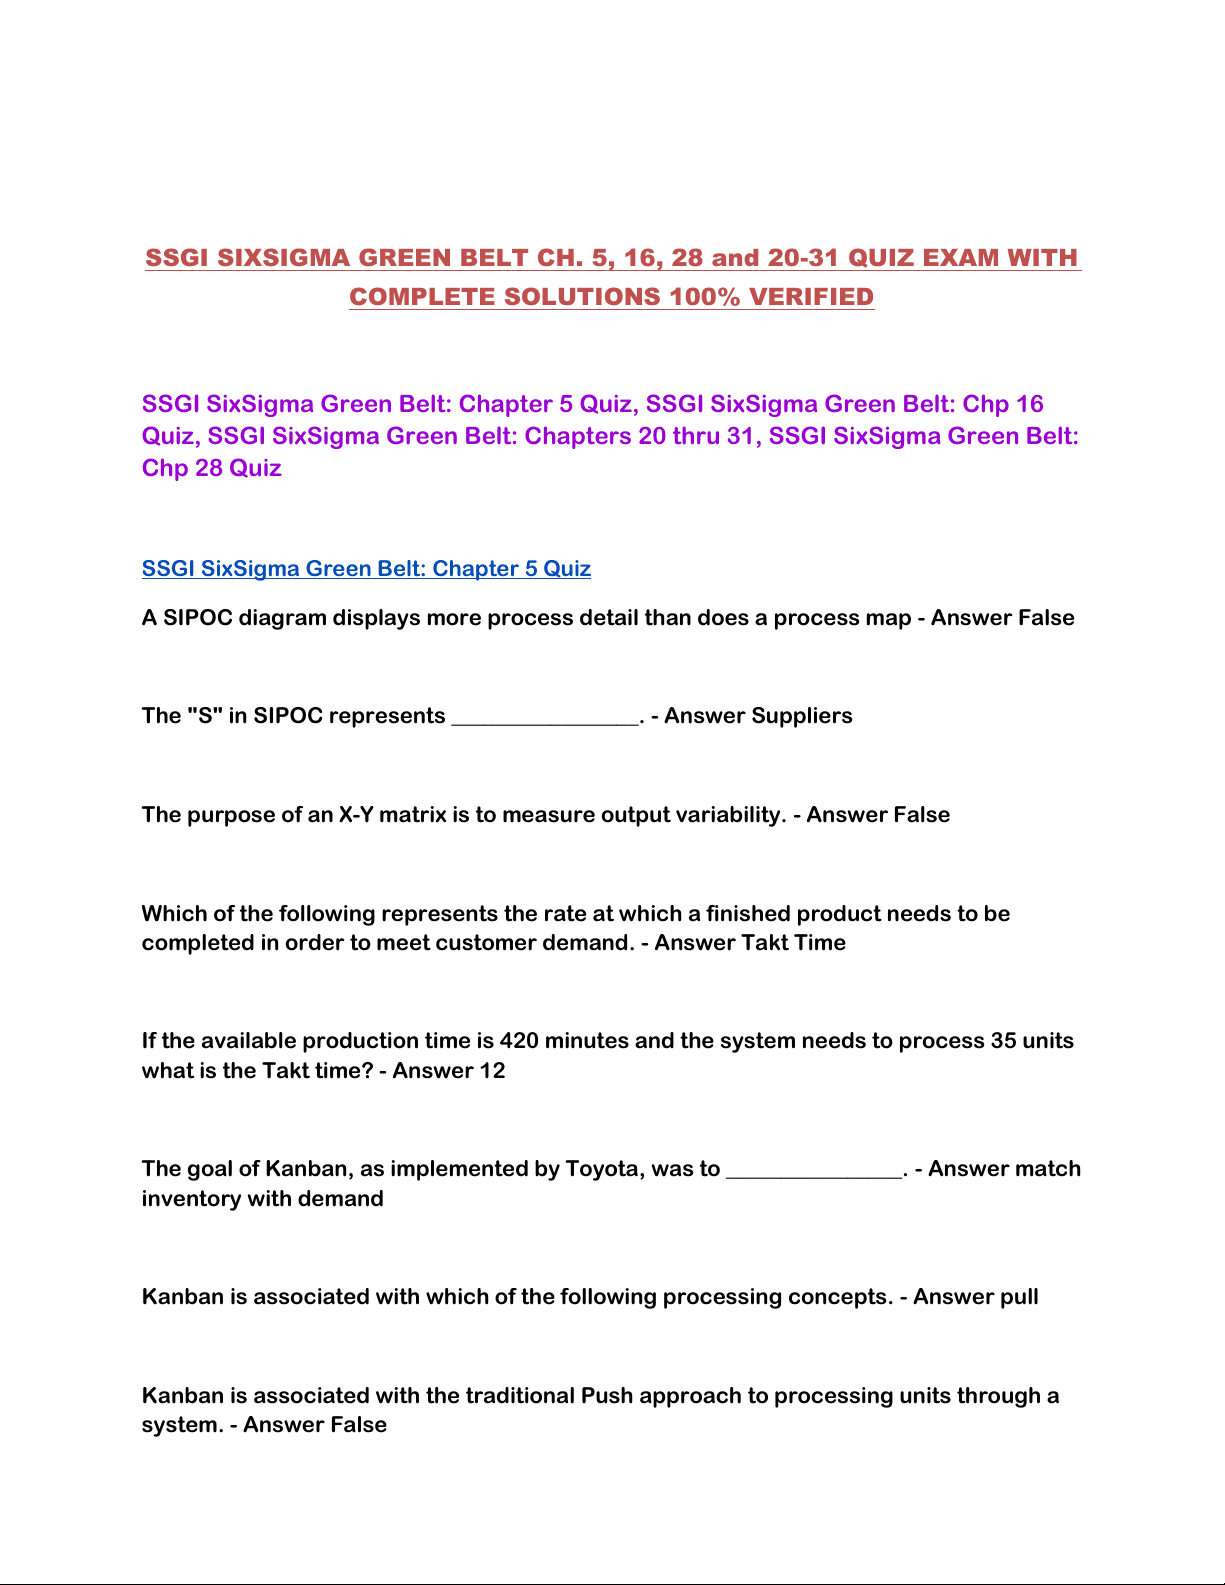
SSGI SixSigma Green Belt: Chapter 5 Quiz A SIPOC diagram displays more process detail than does a process map - Answer False The "S" in SIPOC represents _________________. - Answer Suppliers The purpose of an X-Y matrix is to measure output variability. - Answer False Which of the following represents the rate at which a finished product needs to becompleted in order to meet customer demand. - Answer Takt Time
If the available production time is 420 minutes and the system needs to process 35 unitswhat is the Takt time? - Answer 12
The goal of Kanban, as implemented by Toyota, was to ________________. - Answer matchinventory with demand
Kanban is associated with which of the following processing concepts. - Answer pull Kanban is associated with the traditional Push approach to processing units through asystem. - Answer False
Kanban is related to Just in Time inventory strategies. - Answer True The word Kanban refers to a ____________. - Answer Visual Sign In a Two Bin Kanban process, orders are placed after the second bin is depleted. -Answer False, They are placed once the first bin is depleted of inventory items
Kanban concepts are restricted to manufacturing operations. -Answer False Non-value added time is defined as the difference between total time taken by theprocess of an order minus time of completion for each of the steps that were essentially included in the order. -Answer True Value-added refers to a concept which denotes something about the product andservice cost to customers. -Answer False
A Value Stream Map is also known as SIPOC diagram - Answer False A "D" shaped figure is used to mark process delays. - Answer True Process steps in a Value Stream Map move from right to left. - Answer False; Left toright
Metrics are measurable objectives required to assess the progress and result of stepsin a Lean or Six Sigma project. - Answer True
The concept of Lean focuses on the efficiency of an entire process. - True
The inputs to an X-Y matrix are weighted using numbers between one and one hundred.-Answer False
The inputs to an X-Y matrix are weighted using numbers between one and one hundred.-Answer True
To determine the most important input variable which of the following models should beused? - Answer X-Y Matrix
In an X-Y Matrix the output variables are weighted by their level of importance. - AnswerTrue
The "Extent of the Relationship" in an X-Y matrix requires that an informal estimate isused to determine this relationship. - Answer True
The output of an X-Y matrix is a weighted score. - Answer True A SIPOC diagram does not include delays and other measures of inefficiency. - AnswerTrue
A SIPOC diagram identifies __________. - Answer suppliers, inputs, process, outputs,consumer
A process map not only includes process steps but also includes work flow decisions. -Answer True
Which of the following is a high-level map of a process that does not include much detail.- Answer SIPOC SSGI SixSigma Green Belt: Chp 16 Quiz The closer are the observations in a distribution, the larger is the standard deviation. -ANSWER False
As the standard deviation gets larger, the variation in the data gets smaller. -False ANSWER
The benefit of the standard deviation over the range is that it uses every data item in thedataset to measure variation not just the lowest and highest values. - ANSWER True
If the highest number in a range is 40 and lowest is 22, an estimate of the standarddeviation is 3. - ANSWER True
The greater is the variation of data in a dataset, the lower will be the standard deviation.- ANSWER False
When the standard deviation is larger in dataset A than it is in dataset B, this indicatesthat the spread of the data from the mean is greater in dataset A. - ANSWER True
The standard deviation for waiting time at a clinic should be large to accommodatethose who arrive late for appointments. - ANSWER False
The mean is a measure of centralness of a distribution. - ANSWER True There are two statistics that can be used to summarize a distribution. They include themean and average. - ANSWER False
The standard deviation is a measure of the extend of the spread of the data in a dataset -ANSWER True
In order to better schedule patients through an MRI, the standard deviation for thelength of time it takes to complete the process for particular scans should be as small as possible. - ANSWER True
range is that the standard deviation is a statistical measure that involves every item inthe data set. - ANSWER True
The mean describes the "centralness" of a data set whereas the standard deviationdescribes the spread of the data items about the mean. - ANSWER True
If the range of a data set is relatively narrow, the standard deviation will be relativelylarge. - ANSWER False
The objective in an emergency department is to register and process all patientsquickly. This would indicate that if patient registration and processing times were recorded, the standard deviation of this data set should be small. - ANSWER True SSGI SixSigma Green Belt: Chapters 20 thru 31 Alpha and beta errors help to establish where the UCL and LCL will be positioned on thecontrol chart. - ANSWER True
Alpha and Beta errors need only be considered when creating charts that monitormeans not charts that monitor variation. - ANSWER False
The UCL and LCL can be positioned anywhere on the control chart. However, theirpositioning will affect the probability of the errors that can occur in determining whether or not the process is in or out of control. - ANSWER True When the UCL and LCL are set at plus and minus 2 standard deviations from the mean,the probability of an alpha error is 95%. - ANSWER False
Consider an in-control process; that is its average as well as the spread, is within thepredicted specification. If the UCL and LCL have been set at plus or minus 3 standard deviations from the mean. The probability that a sample mean falls above the upper limitor below the lower limit is 1.00 -.997 or.003 percent. Assume this has happened. A process is turned off, and problems are looked for. A beta error has happened. -
ANSWER False The Alpha error is considered too large. It can be made smaller by raising the LCL andlowering the UCL. In other words it can be made smaller by decreasing the distance between the UCL and LCL on the control chart. - ANSWER False The result of raising the UCL and lowering the LCL is that the Alpha error will bereduced. - ANSWER True
An alpha error detects a process change that is not present while a beta error fails todetect a process change that is present. - ANSWER False
Setting the UCL and LCL requires that the costs associated with Beta and Alpha errorsbe balanced. - ANSWER True
Suppose it is critically important to determine when a process mean has shifted. In thissituation the UCL and LCL should be set such that the Beta error is small. - ANSWER True If the Alpha error is relatively large, the Beta error will be relatively small. -True ANSWER
The mean from a process has shifted but a sample result falls within the UCL and LCL,This is an example of a Beta error. - ANSWER True
To detect even the smallest shift in a process mean it would be necessary to set the UCLand LCL close to the process mean. - ANSWER True
The Beta error associated with monitoring and controlling the radiation level in anuclear reactor plant should be large. - ANSWER False
For most processes, the X-bar chart is the only chart needed to monitor process output.- ANSWER False
There are three types of data including continuous, discrete and digital. -False ANSWER
Data that can be measured on a continuum are called discrete data. - ANSWER False Customer satisfaction registered on a scale from one to ten is an example of continuousdata. For example, a customer could rate satisfaction as 6.5. - ANSWER True
Declaring whether or not you will vote in an upcoming election (yes or no) is an exampleof continuous data. - ANSWER False
Attribute data is the same as Continuous data. - ANSWER False The first decision when choosing an appropriate control chart is whether or not the dataare continuous or discrete. - ANSWER True
When the sample size is large and discrete data will be collected, a P-Chart is used. -ANSWER True
The choice of which appropriate chart to utilize is independent of the sample size that istaken from the process. - ANSWER False
X-Bar and S-Charts are used when the data that is sampled is continuous and thesample size is > 12 but < 25. - ANSWER True
Which of the following is not a Six Sigma control chart? - ANSWER Q-chart When Sample sizes are larger than 25 an X-Bar chart is used to monitor process means.- ANSWER True
There is no need to develop an S chart when sample sizes are more than 12. -False ANSWER
R-Charts are used only when sample sizes are more than 12. - ANSWER False P-Charts are for continuous data. - ANSWER False X-Bar chart is to monitor the process means when the data are discrete. -False ANSWER
Once the type of control chart has been selected, the center line of control must bedetermined. - ANSWER True
Process means, which measure the capability of a process, cannot be changed bysimply adjusting the UCL and LCL. - ANSWER True
In practice, only one small sample of process output must be taken in order to estimatethe mean of a process for the purpose of developing the center line on the control chart.
R-Charts are used to monitor process means. - ANSWER False R-Charts are used to monitor process variation by plotting the range of the itemscollected in a sample. - ANSWER True
The center line in an R-Chart represents the process mean. - ANSWER False The R-Chart is used when monitoring process variation for discrete data. -False ANSWER
The center line for an R chart is found by taking several samples, computing the rangefor each of the samples and then calculating the average of these ranges. - ANSWER True The purpose for constructing and using an R chart is to identify when the processvariation is greater than would be expected. - ANSWER True
The values D(4) and D(3) are used in the formula when calculating the UCL and LCL forR-Charts. - ANSWER True
A sample taken from a process that is in operation the sample mean is plotted on theR-Chart. - ANSWER False
The range in an R-Chart is an approximation of the variation in sample means from onesample to the next. - ANSWER True
An R-Chart is used to determine if the output from a process produces consistentresults. - ANSWER True
X-Bar Charts, whose sample sizes are below 12, depend upon the range of preliminary
samples to determine the UCL and LCL. However, in X-bar charts, where sample sizesare between 12 and 25, standard deviation of preliminary samples is considered to determine these levels. - ANSWER True When developing an X-Bar chart for continuous data and when the sample size will be14, the standard deviation is utilized to find the UCL and LCL. - ANSWER True
To establish the center line for X-Bar charts, when the sample size is between 12 and 25,the grand mean of preliminary samples is calculated. - ANSWER True
When developing an X-Bar chart for intermediate size samples, an average value of thestandard deviation must be calculated from several preliminary samples in order to determine a center line for the chart - ANSWER False In an X-Bar chart where the sample size is between 12 and 25, it will not be necessary totake several preliminary samples to establish a center line on the chart since most sample means for samples of this size will be the same. - ANSWER False Before plotting the average of one sample on an x-bar chart, the sample average mustbe divided by the square root of the sample size. - ANSWER False
In an X-Bar Chart when the sample size is between 12 and 25, the constant D(4) is usedto determine both the UCL and LCL. - ANSWER False
A sample taken only when the sample sizes varies from 12 to 25, preliminary samplesgive the center line of an X-Bar chart. - ANSWER True
The process mean is given as 35. The Sample size is 25, mean standard deviation is 5and the value of A3 is 0.606. The UCL will be 38. - ANSWER True
Once the X-Bar chart has been designed for samples between 12 and 25, a chart thatmonitors the variation in process output would not be required because the sample size is larger than 12. - ANSWER False
What is the LCL? - ANSWER 69 When the sample size is precisely 25, the shortcut and non-shortcut methods willproduce very close to the same UCL and LCL. - ANSWER True
The UCL and LCL will be placed closer to the process mean or center line of the controlchart as the estimate of the standard deviation becomes smaller. - ANSWER True
The range is used as an estimate of the standard deviation when sample sizes aregreater than 25 - ANSWER False
The mean of a sample is plotted on the X-Bar chart when sample sizes are greater than25. - ANSWER True
When sample sizes are greater than 25, every sample that is taken and placed on anX-Bar chart will fall symmetrically or in a bell curve around the center line of the chart. - ANSWER True One reason why small size samples of less than 25 items or units is taken is because thecost of sampling a larger number would be expensive. - ANSWER True
When process variation is greater, we would expect that the LCL and UCL would be setfarther apart. - ANSWER True
P-Charts are used only for small size samples when the data are continuous. -ANSWER False
Discrete data can be summarized as a proportion such as the percent of customers thatwould recommend a website to a friend. - ANSWER True
A quality control system together with control charts has been set up to monitor the
length of time in hours it takes for an order to be shipped to a customer. The type of datamonitored in this system would be classified as attribute. - ANSWER False
Sample of 30 customers rate a product as satisfactory or unsatisfactory. The data in thesample would be discrete data. - ANSWER True
Consider that a P-Chart has been designed and is ready for use. When entering sampleresults into the chart, the results will be entered in the form of a percentage. One result for online product return process would be 15% or 0.15. - ANSWER True The centerline for a P-Chart would be determined by taking several preliminarysamples, determining the proportion for each sample group and finally computing the average of these group proportions. - ANSWER True The long time average of rejects from a process is 2%. When constructing a P-Chart,and assuming the process has not changed the 2% could be used as the centerline of the control chart. - ANSWER True When determining the UCL and LCL for proportions it is not necessary to consider thesize of the sample. - ANSWER False
The width between the UCL and LCL in a P-Chart decreases as the sample sizedecreases. - ANSWER False
The number of returns received by an online retailer is a situation where a P-Chartwould be appropriate. - ANSWER False
The number "3" in the formula, used to determine the UCL and LCL, represents thesetting of these limits at three standard errors of the proportion on either side of the centerline. - ANSWER True When developing the UCL and LCL in a P-Chart, and assuming that these limits are to beset at plus and minus three standard errors of the proportion from the centerline, only
Process capability depends upon three variables; the LSL, USL and standard deviationof the process. - ANSWER True
The difference between what a customer expects and what a process delivers is thedifference between the LSL and USL. - ANSWER False; The difference is the distance between the LSL and LCL and the distance between the USL and UCL The LSL and USL must be contained within the LCL and UCL. - ANSWER False Both the LSL and USL are above the Mean (center line) or the process is out-of-control. -ANSWER False
When the UCL and LCL are moved closer to the center line, the USL and LSL would notbe affected. - ANSWER False
The Taguchi loss function suggests that the loss to the organization gets larger andlarger as process variation migrates farther and farther away from the mean. - ANSWER True Process capability measures how close a process is running to its capability or servicelimits. - ANSWER True
If process capability is 10, this suggests the process is very capable of meetingcustomer expectations as expressed by the LSL and USL. - ANSWER True
When determining process capability, the larger is the estimate of the standarddeviation of the process, the lower is the process capability. - ANSWER True
To compute process capability you must have the UCL and LCL. - ANSWER False In general, a process capability of 10 or greater is preferred. - ANSWER False
Process capability depends upon the difference between the USL and LSL. -True ANSWER
It is not possible for process capability to be greater than 60. - ANSWER False Failure Mode and Effects Analysis is primarily used in the inspection process after itemshave been manufactured. It assures that defective output is not passed on to the customer or client. -occurring not to correct them once they have occurred. ANSWER False; It is intended to prevent problems from
Brainstorming sessions are held to identify problems before they occur. -True ANSWER
The more difficult it is to detect a problem the higher will be its RPN. - ANSWER True RPN measures the cost of defectives. - ANSWER False While RPN is a quantitative measure, FMEA is primarily a qualitative tool. -True ANSWER
RPN is an abbreviation for Reject Priority Number - ANSWER False In the RPN calculation the letter "O" represents the frequency with which the problem islikely to occur. - ANSWER True
FMEA is a proactive approach that looks at what could go wrong with a process,product or service before the design is finalized. - ANSWER True
FMEA is a process that attempts to correct process problems once they have occurred.- ANSWER False