

Study with the several resources on Docsity
Earn points by helping other students or get them with a premium plan
Prepare for your exams
Study with the several resources on Docsity
Earn points to download
Earn points by helping other students or get them with a premium plan
Community
Ask the community for help and clear up your study doubts
Discover the best universities in your country according to Docsity users
Free resources
Download our free guides on studying techniques, anxiety management strategies, and thesis advice from Docsity tutors
Material Type: Assignment; Professor: Sinn; Class: Elementary Statistics; Subject: Mathematics; University: North Georgia College & State University; Term: Spring 2010;
Typology: Assignments
1 / 2
This page cannot be seen from the preview
Don't miss anything!
Introduction to Statistics Advanced P-Value Worksheet Name _____________________________
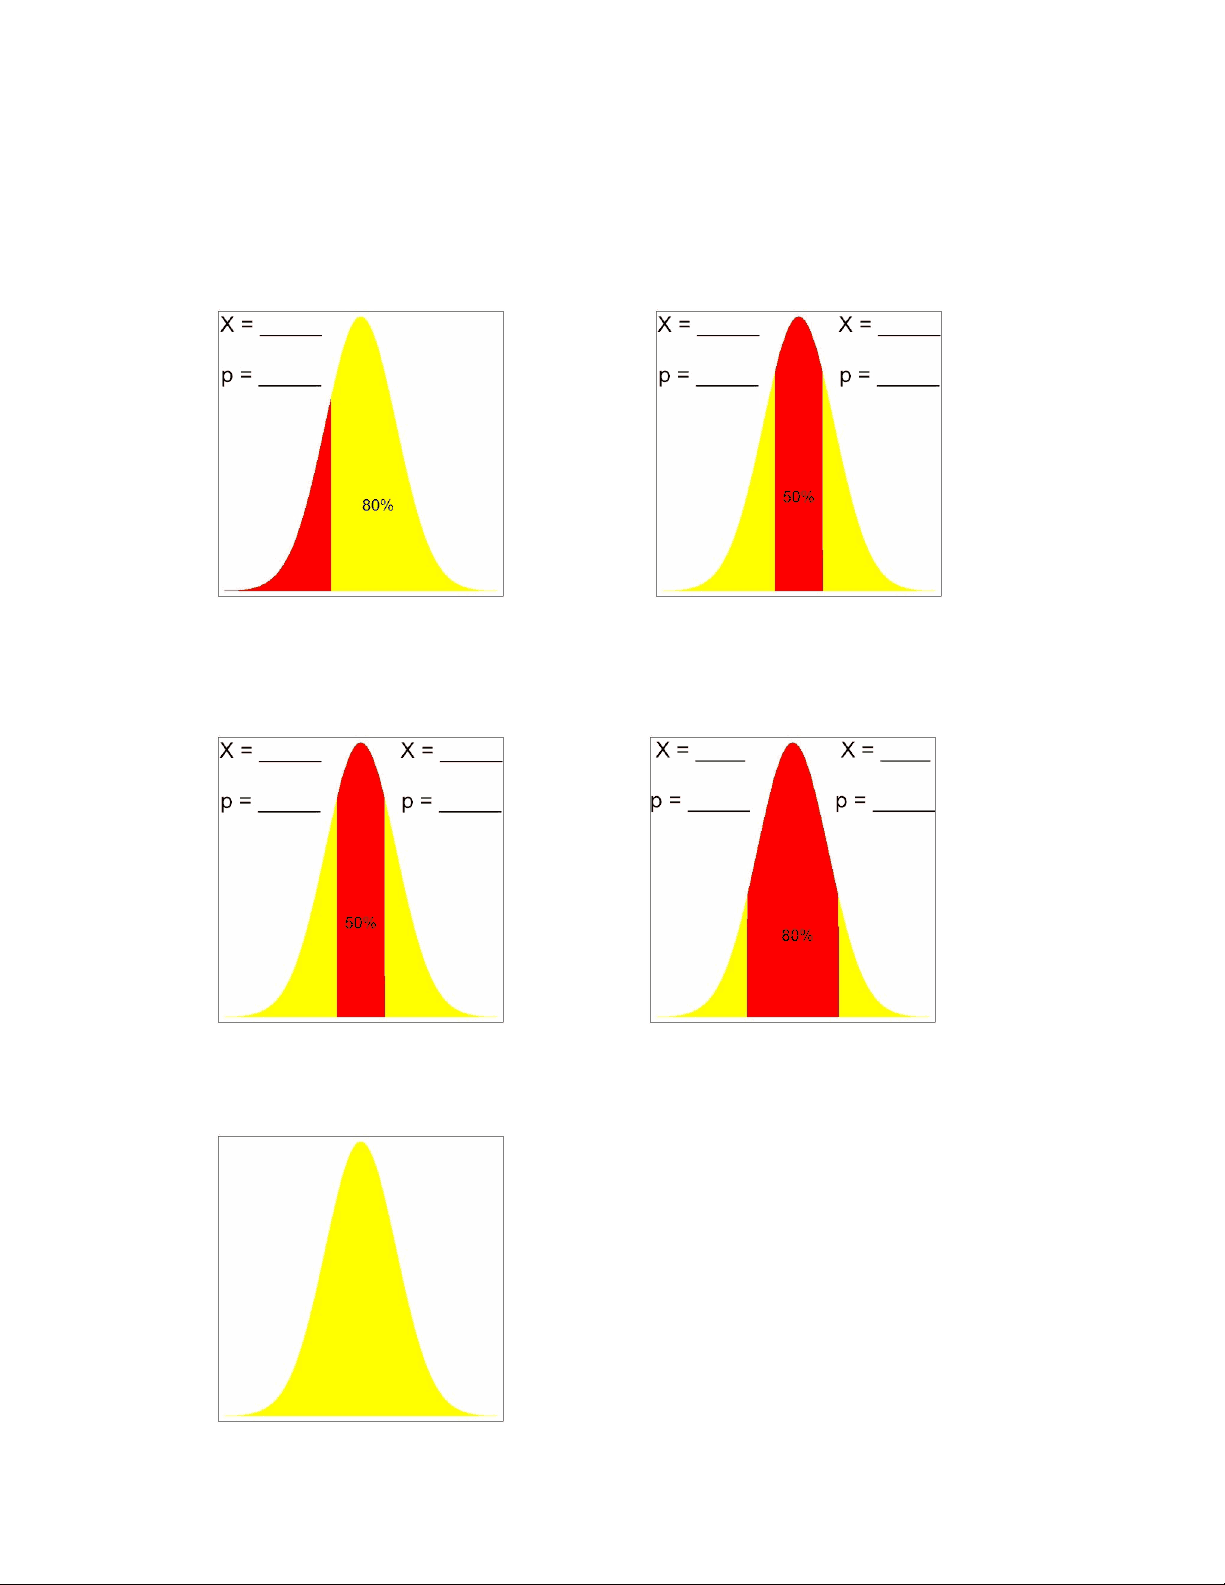
1. On a practical nursing exam, the mean is 79 and std. dev. is 9. Find the test scores related to the area in the charts below: a. Upper 80% b. Middle 50% 2. For the standard normal curve, find the test scores related to the area in the charts below: a. Middle 50% b. Middle 80% 3. On the practical nursing exam (mean is 79, std. dev. is 9), scores of 75 and higher are considered passing. Find the percent of students that pass and mark the appropriate areas on the figure below:
4. The entrance exam scores for a private high school are converted to standardized Z- scores. Only Z-scores of 1.25 and higher are considered for admission. What percent of applicants are eligible? Draw and shade the appropriate areas below: Police response time in Denver has a normal distribution where the mean is 8.4 minutes and the std. dev. is 1.7. Use the blank templates below to sketch the region indicated, and find all requisite p-values and X-values. 5. P(5 < X < 10) “between 5 and 10 min.” 6. P(X < 6) “less than 6 min.” 7. The “Middle 60%” of response times. 8. The “Upper Quartile” of response times.