
EEMB 129 Midterm I Name__________________________
2011 Perm #__________________________
Read each question carefully before you answer it.
Make sure that you show your work.
1.#(12#pts#total)#In#pea#plants,#tall#plant#height#(T)#is#dominant#over#short#(t).#Pure;
breeding#tall#and#short#plants#are#crossed.#
A. #(4#pts)#What#will#be#the#genotype#and#phenotype#of#the#F1?#
Tt#$#Tall#
#
B. (4 pts) If the F1 is selfed and 400 F2 plants are raised, how many plants would be
expected in each phenotypic class?
300#–#Tall# # 100#$#Short#
#
C. #(4#pts)#How#many#of#the#F2#plants#would#be#expected#to#be#pure#breeding#
when#selfed?#
200#(100#TT#and#100#tt)#
#
#
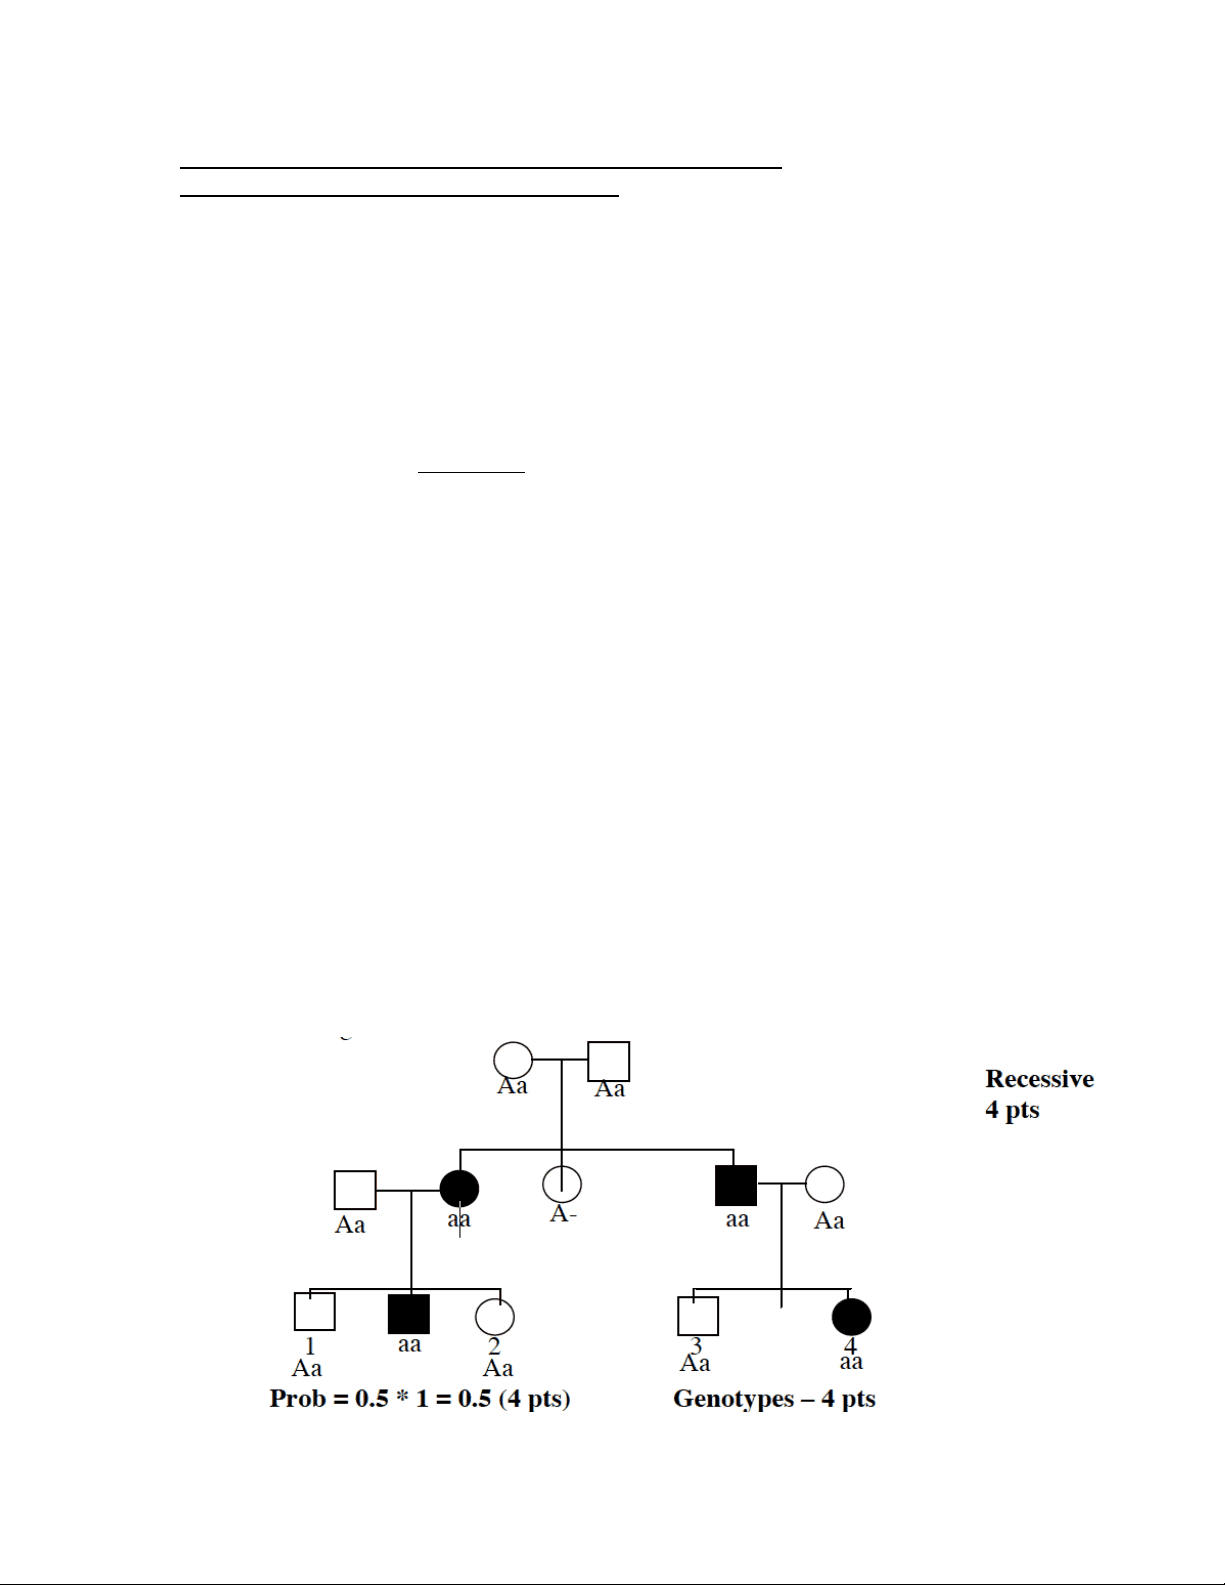
2. (12 pts) Below is a pedigree of a human genetic disease in which stricken individuals
are represented by solid color.
a. Is the disease caused by a dominant or recessive allele?
b. Indicate the genotypes of as many individuals as possible.
c. Calculate the probability an offspring of the cousin marriage 1 x 4 will have the
disease.