Download Sine/Cosine Graphs - Examples with Resolution | MATH 117 and more Study notes Trigonometry in PDF only on Docsity!
MATH 117 Sine/Cosine Graphs
Each trigonometric function can be graphed as a function of x , where the variable x is always in radians. In particular, the functions y = sin x and y = cos x are defined for all x and are cyclic. That is, the shape of the graph repeats itself over the periods
.... − 4 π ≤ x ≤ − 2 π − 2 π ≤ x ≤ 0 0 ≤ x ≤ 2 π 2 π ≤ x ≤ 4 π 4 π ≤ x ≤ 6 π... etc.
which are simply wrap-arounds of the unit circle.
The Sine Graph
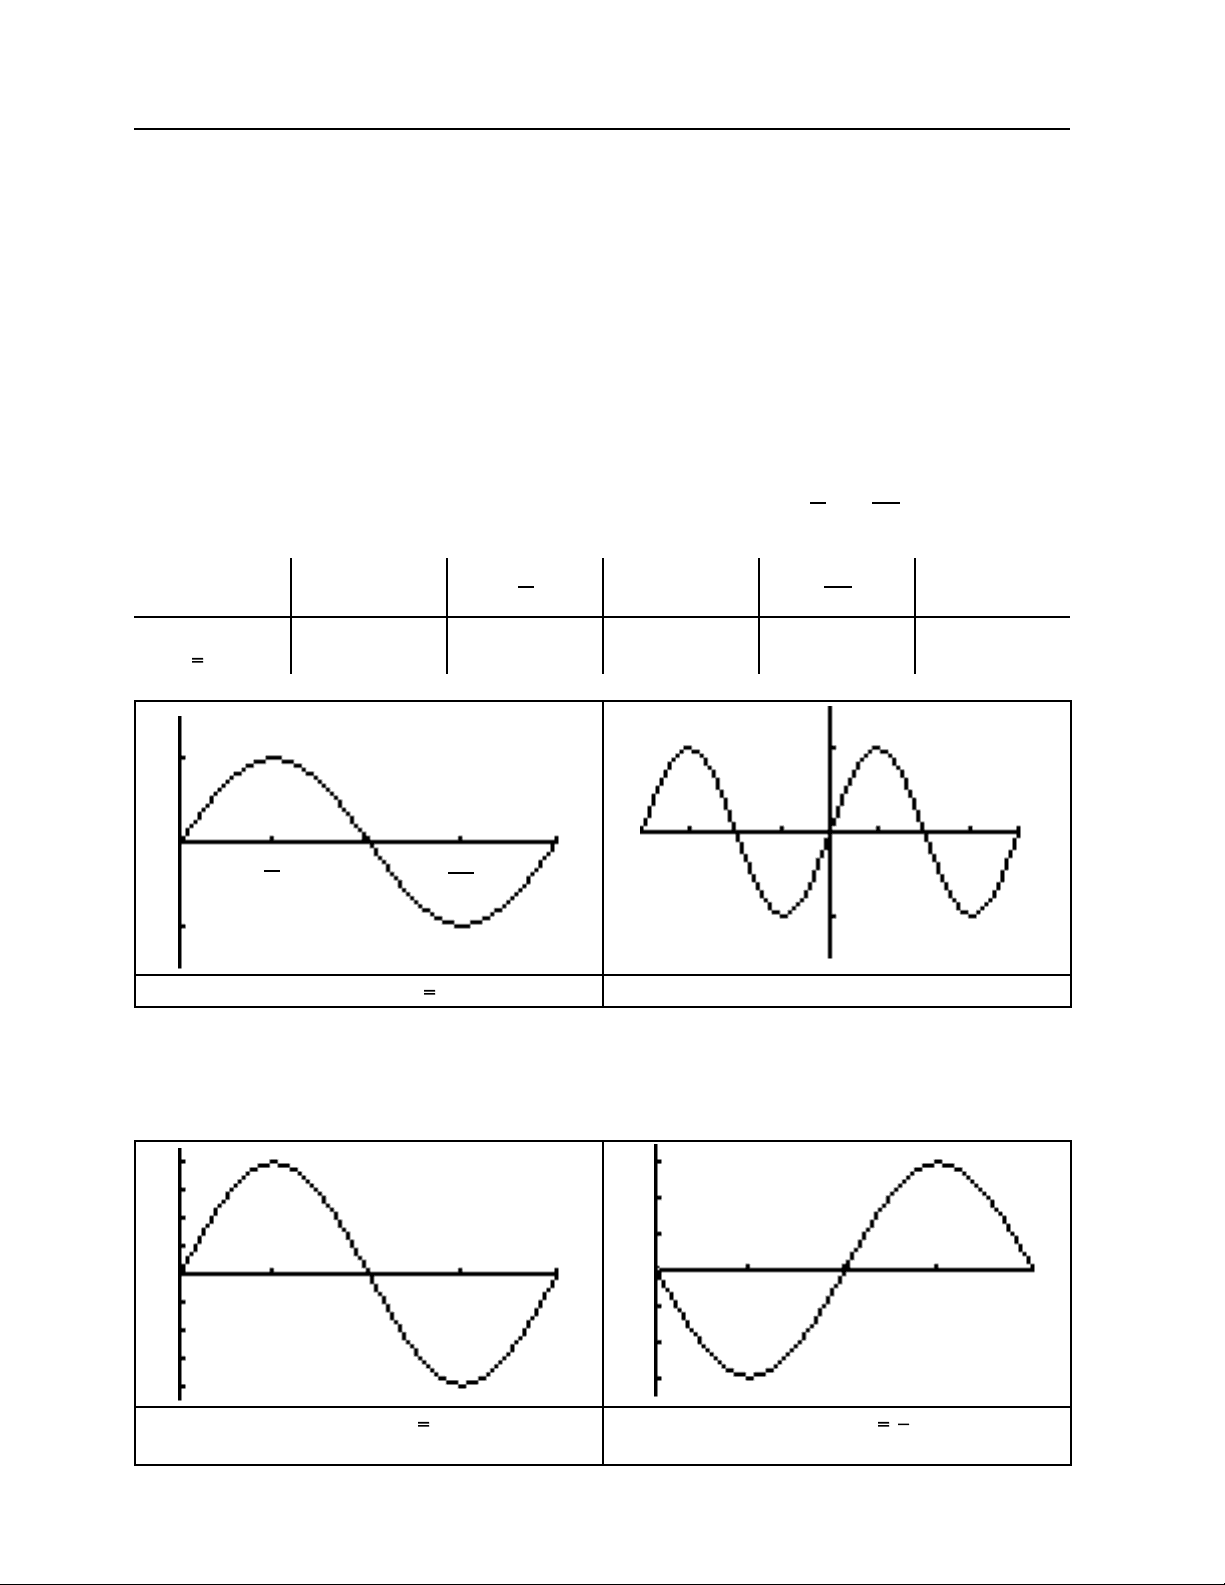
One cycle of the sine graph occurs as x ranges from 0 to 2π (radians), and the shape of
the graph can be molded around the values occuring at x = 0, π 2
, π, 3 π 2
, and 2π.
x (^) 0
π 2 π^
3 π 2 2 π
y sin x^0 1 0 –1^0
π 2 π 2
π 3 π 2
–2π 2 π
One Cycle of y sin x Two Cycles
Multiplying by a negative reflects the graph about the x -axis and multiplying by a constant “ a ” increases the range to – a ≤ y ≤ a rather than –1 ≤ y ≤ 1.
2 π
π
π/2^2 π
One Cycle of y 4sin x Amplitude = 4
One Cycle of y 3sin x Amplitude = |–3| = 3
Phase Shift
Given the graph of y = f ( x ) , we can shift the graph to the right by c units with the function y = f ( x − c ). We shift to the left c units with the function y = f ( x + c ).
(^3) – y = x^2 y = ( x − 3)^2 shifts x^2 to the right by 3
y = ( x + 2)^2 shifts x^2 to the left by 2
Similarly, we can shift the sine graph to the left or right by a certain angle with the function y = a sin( x ± c ). ––––––––––––––––––––––––––––––––––––––––––––––––––––––––––––––––––––––––––––––
Example 1. Graph one cycle each of the following functions. Label five points on the x - axis that show where the roots and the peaks occur.
(a) y = 2sin x + π 3
^
^ (b)^ y^ = −3sin^ x^ −
π 4
^
Solution. (a) The sine graph is shifted to − π 3
, where one cycle begins. One cycle ends
after length 2 π which is at − π 3
6 π 3
5 π 3
. So now divide the cycle length of
2 π into 4 equal pieces of length 2 π 4
π 2
. To do so, we must add lengths of π 2
from the
starting point of − π 3
. That is, start at − 2 π 6
and start adding 3 π 6
Start at − 2 π 6
Add 3 π 6
Add 3 π 6
Add 3 π 6
Add 3 π 6 − π 3
2 π 6
π 6
4 π 6
2 π 3
7 π 6
10 π 6
5 π 3 2
π 6
7 π 6
5 π 3
2 π 3
− π 3
y = 2sin x + π 3
^
π
π 2
5 π 2
2 π
π
y 2cos x Amplitude = 2
One Cycle of y 5cos x Amplitude = |–5| = 5
Example 2. Graph one cycle each of the following functions. Label five points on the x - axis that show where the roots and the peaks occur.
(a) y = 3cos x − π 6
^
^ (b)^ y^ = −4cos^ x^ +
π 8
^
Solution. (a) The cosine graph is shifted to + π 6
, where one cycle begins. Divide the
cycle length of 2 π into 4 equal pieces of length 2 π 4
3 π 6
, and add these lengths of 3 π 6
from the starting point of π 6
Start at π 6
Add 3 π 6
Add 3 π 6
Add 3 π 6
Add 3 π 6 π 6
4 π 6
2 π 3
7 π 6
10 π 6
5 π 3
13 π 6
π 6
2 π 3
7 π 6
13 π 6
5 π 3
y = 3cos x − π 6
^
(b) The negative cosine graph is shifted to − π 8
, where one cycle begins. Divide the
cycle length of 2 π into 4 equal pieces of length 2 π 4
4 π 8
, and add these lengths of 4 π 8
from the starting point of − π 8
Start at − π 8
Add 4 π 8
Add 4 π 8
Add 4 π 8
Add 4 π 8 − π 8
3 π 8
7 π 8
11 π 8
15 π 8
− π 8
3 π 8
7 π 8
11 π 8
15 π 8
y = −4cos x + π 8
^