

Study with the several resources on Docsity

Earn points by helping other students or get them with a premium plan


Prepare for your exams
Study with the several resources on Docsity

Earn points to download
Earn points by helping other students or get them with a premium plan
Community
Ask the community for help and clear up your study doubts
Discover the best universities in your country according to Docsity users
Free resources
Download our free guides on studying techniques, anxiety management strategies, and thesis advice from Docsity tutors
A test consisting of multiple choice questions and answers on various topics including graphs, statistics, functions, and algebra. The test covers concepts such as domain and range of functions, mean and median, negative association, concavity, piecewise functions, and calculus. Students are required to identify the correct answer for each question, which is worth a certain number of points.
Typology: Exams
1 / 5

This page cannot be seen from the preview
Don't miss anything!


Test 1 Name______________________________ September 17, 2002
The first 8 questions are multiple choice. Circle the letter of the best answer. Each question is worth 4 points.
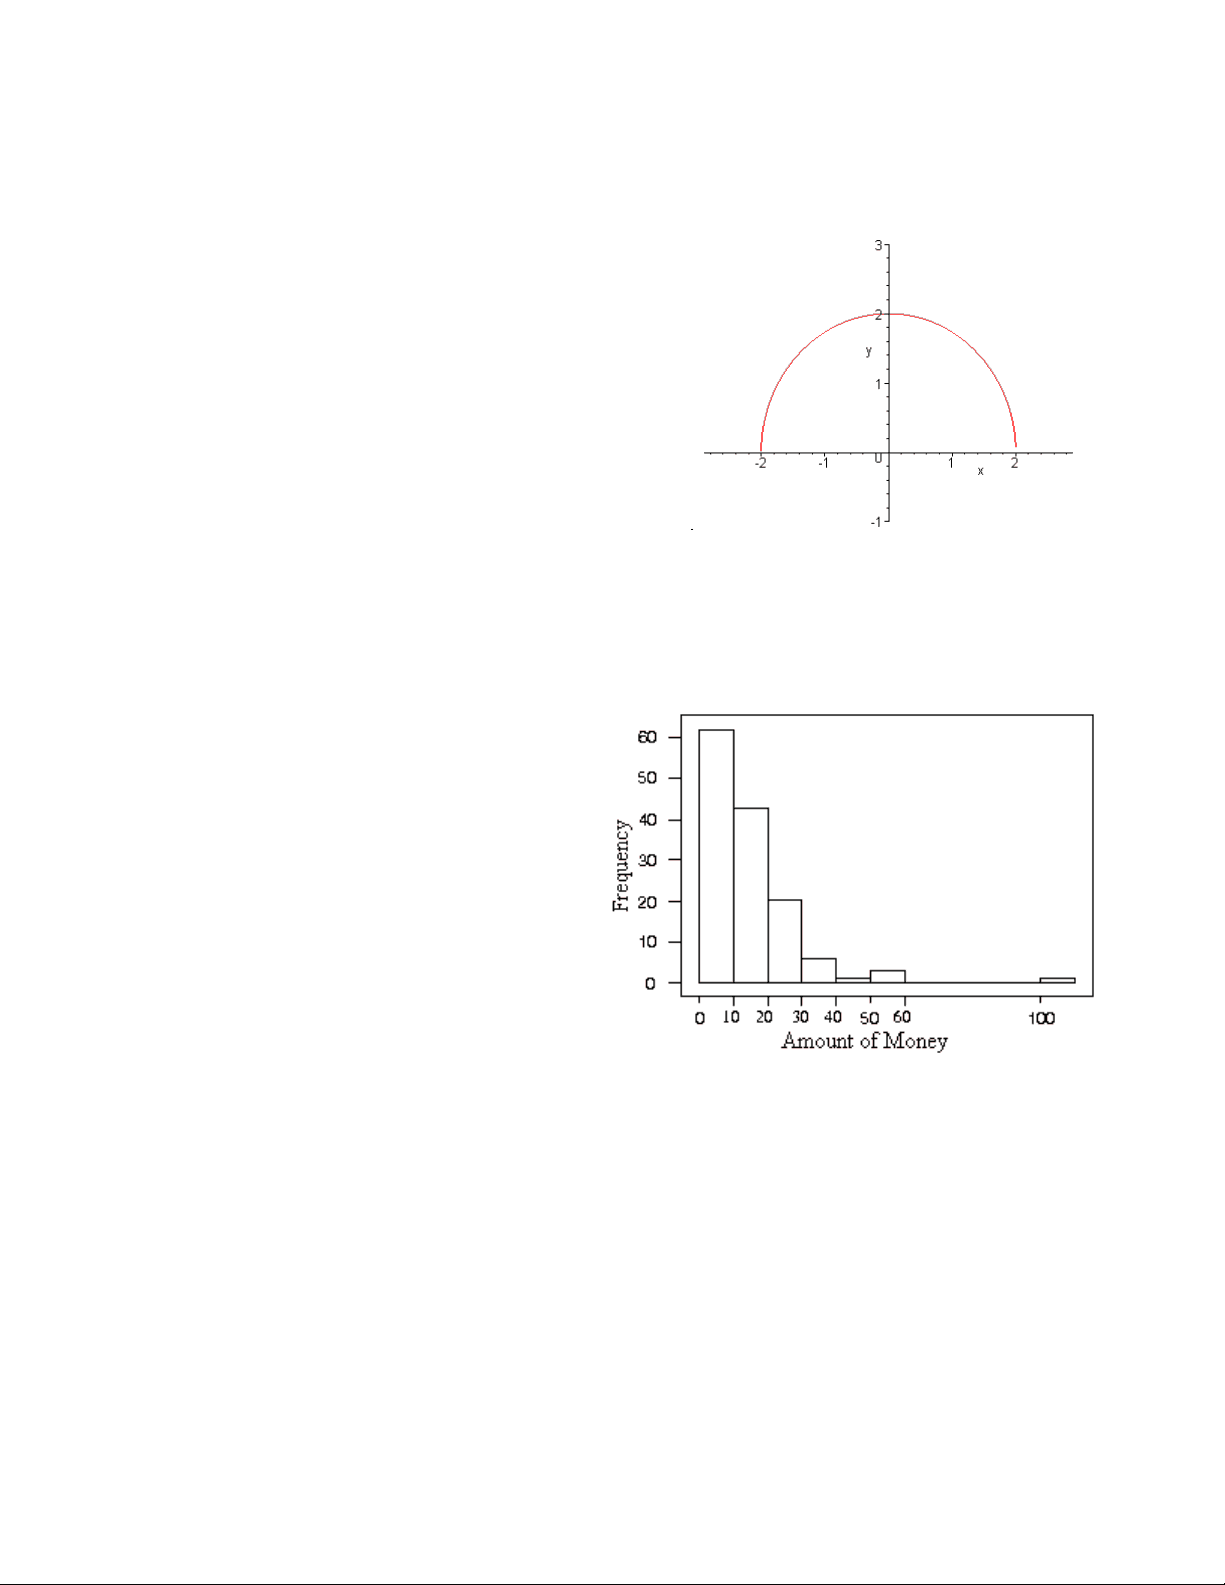
a) The domain of g is 0 x 2 and the range is 2 g ( x ) 2. b) The domain of g is 2 x 2 and the range is 0 g ( x ) 2. c) The domain of g is all real numbers and the range is all real numbers. d) The domain of g is x 0 and the range is g ( x ) 0.
a) The mean is smaller than the median. b) The mean is larger than the median. c) The mean and the median are approximately the same. d) There is no way to tell the relationship between the mean and median by just looking at a histogram.
a) above average values of one variable tend to accompany below average values of the other. b) above average values of one variable tend to accompany above average values of the other. c) below average values of one variable tend to accompany below average values of the other. d) below average values of one variable can be accompanied by either above or below average values of the other.
a) Increasing and concave up. b) Increasing and concave down. c) Decreasing and concave up. d) Decreasing and concave down.
First 400 kWh $0.085 $34. Next 300 kWh $0.078 $23. Next 140 kWh $0.062 $8.
840 kWh total Total electric $66.
a) if 700
if 400 700
if 400
k
k
k
k
k
k f k
b) if 700
if 400 700
if 400
k
k
k
k
k
k f k
c) if 700
if 400 700
if 400
k
k
k
k
k
k f k
d) if 700
if 400 700
if 400
k
k
k
k
k
k f k
a) Mean b) Median c) Standard Deviation d) The above three of these measures would change.
is f ( 5 )? (6 points)
Shoe size 7 8 9 10 11 Foot length (in) 9 23 10 10 13 10 23 11
a) What is the slope of the function where the input is shoe size and the output is foot length in inches?
b) What does the slope from part (a) mean in terms of shoe size and foot length?
c) Suppose someone has a size 5 shoe, what is the length of his foot?
d) What size shoe corresponds to a foot length of a foot (12 inches)?
if 15 , 000
if 15 , 000 ( ) x
x f x
3 if 0
3 2 if 0 ( ) 2 x x
x x f x. (6 points)
a) f (2)
b) f (2)
1910 19201930 19401950 19601970 19801990 2000
Year
Time (minutes)
338, 160, 210, 180, 166, 272, 128, 409, 240, 250, 160, 300, 340, 200, 194, 132, 202, 180
a) Create a histogram (manually or from your calculator) of the data, where each interval is of width 50. (The first bar will be 100< x <150, the second class will cover 150 < x < 200, etc.)
b) Use the 1-Var Stats on your calculator to find:
Mean __________
Median _________
Standard Deviation _________
Q 1 _________
Q 3 _________
a) Approximately, what was the world record time in 1920?
b) Approximately, what was the world record time in 1990?
c) Approximately, what year did the first runner run in less than 4 minutes?