UTMartin Math140
FunctionsandGraphs PracticeTest
Instructor:YelenaMeadows Page1
1. Determinewhichquadranteachpointbelongstowhenplottedintherectangularsystem.
• 2,7
• 1,9
•
,√2
• 3,2
• 0,5
2. Grapheachequation.
•
3
• |1
|
•
1
•
2
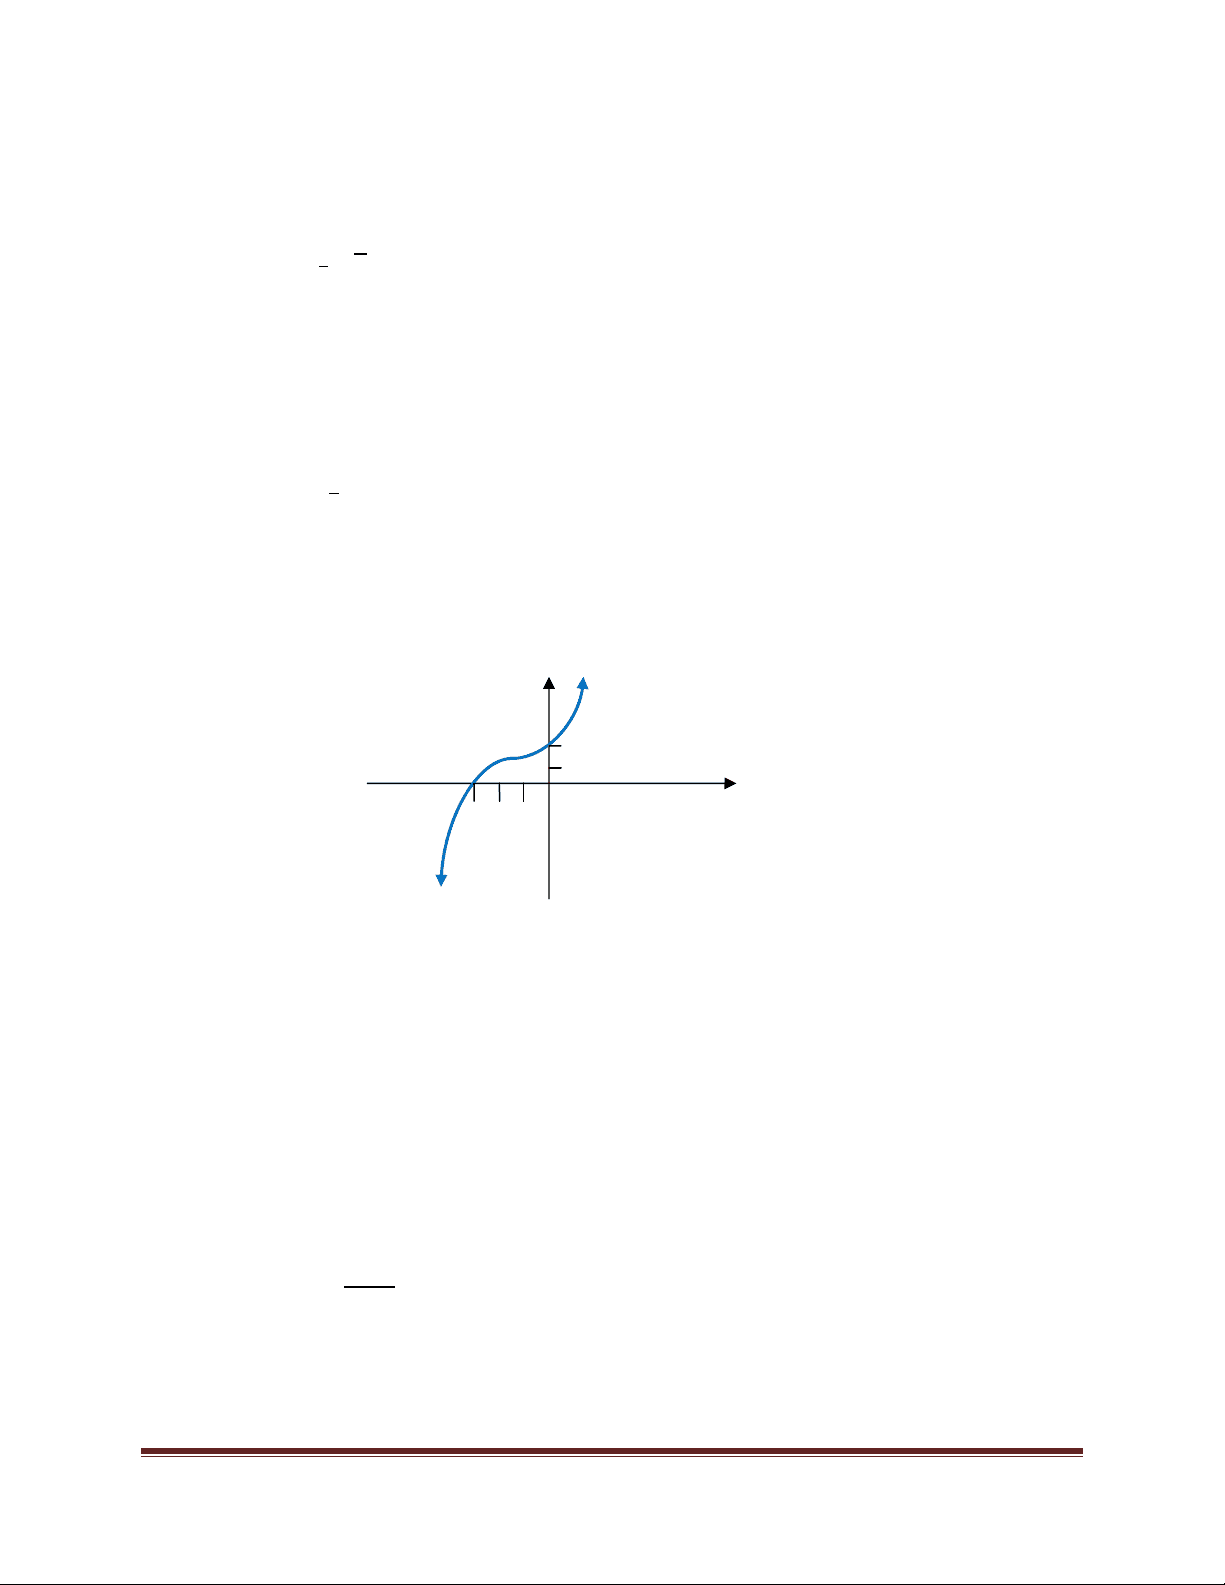
3. Determinethex‐intercept(s),ifany;y‐intercept(s),ifany,ofthegraphgivenbelow(eachtick
markrepresentsoneunit).
4. Determinewhichrelation(s),ifany,arefunctions.
• 1,2,1,3,1,4,1,5
• 2,1,3,1,4,1,5,1
• 1,2,3,4,5,6,7,8
• 1,2,3,4,5,6,5,8
5. Determinewhichequationdefinesyasafunctionofx.
• 20
• 2
0
• 21
• 21
• √1