Download Polynomial Functions: Zeros, Intermediate Value, and End Behavior - Prof. Rebecca Kyler and more Study notes Pre-Calculus in PDF only on Docsity!
Math29 3.1: Polynomial Functions and Their Graphs
Polynomial of degree n in the form: ( )
1 1 ... 1 n n P x a xn an x a x a − = + (^) − + + + 0 Where n ∈ ], n > 0; and an ≠ 0 Terms: Coefficients leading coefficient constant term leading term
Ex: ( )
7 3 2 P x = 5 x + 4 x − 7 x − x + 9 Graphs of Polynomials: Always a smooth curve, with no breaks (always continuous), with no sharp corners or cusps.
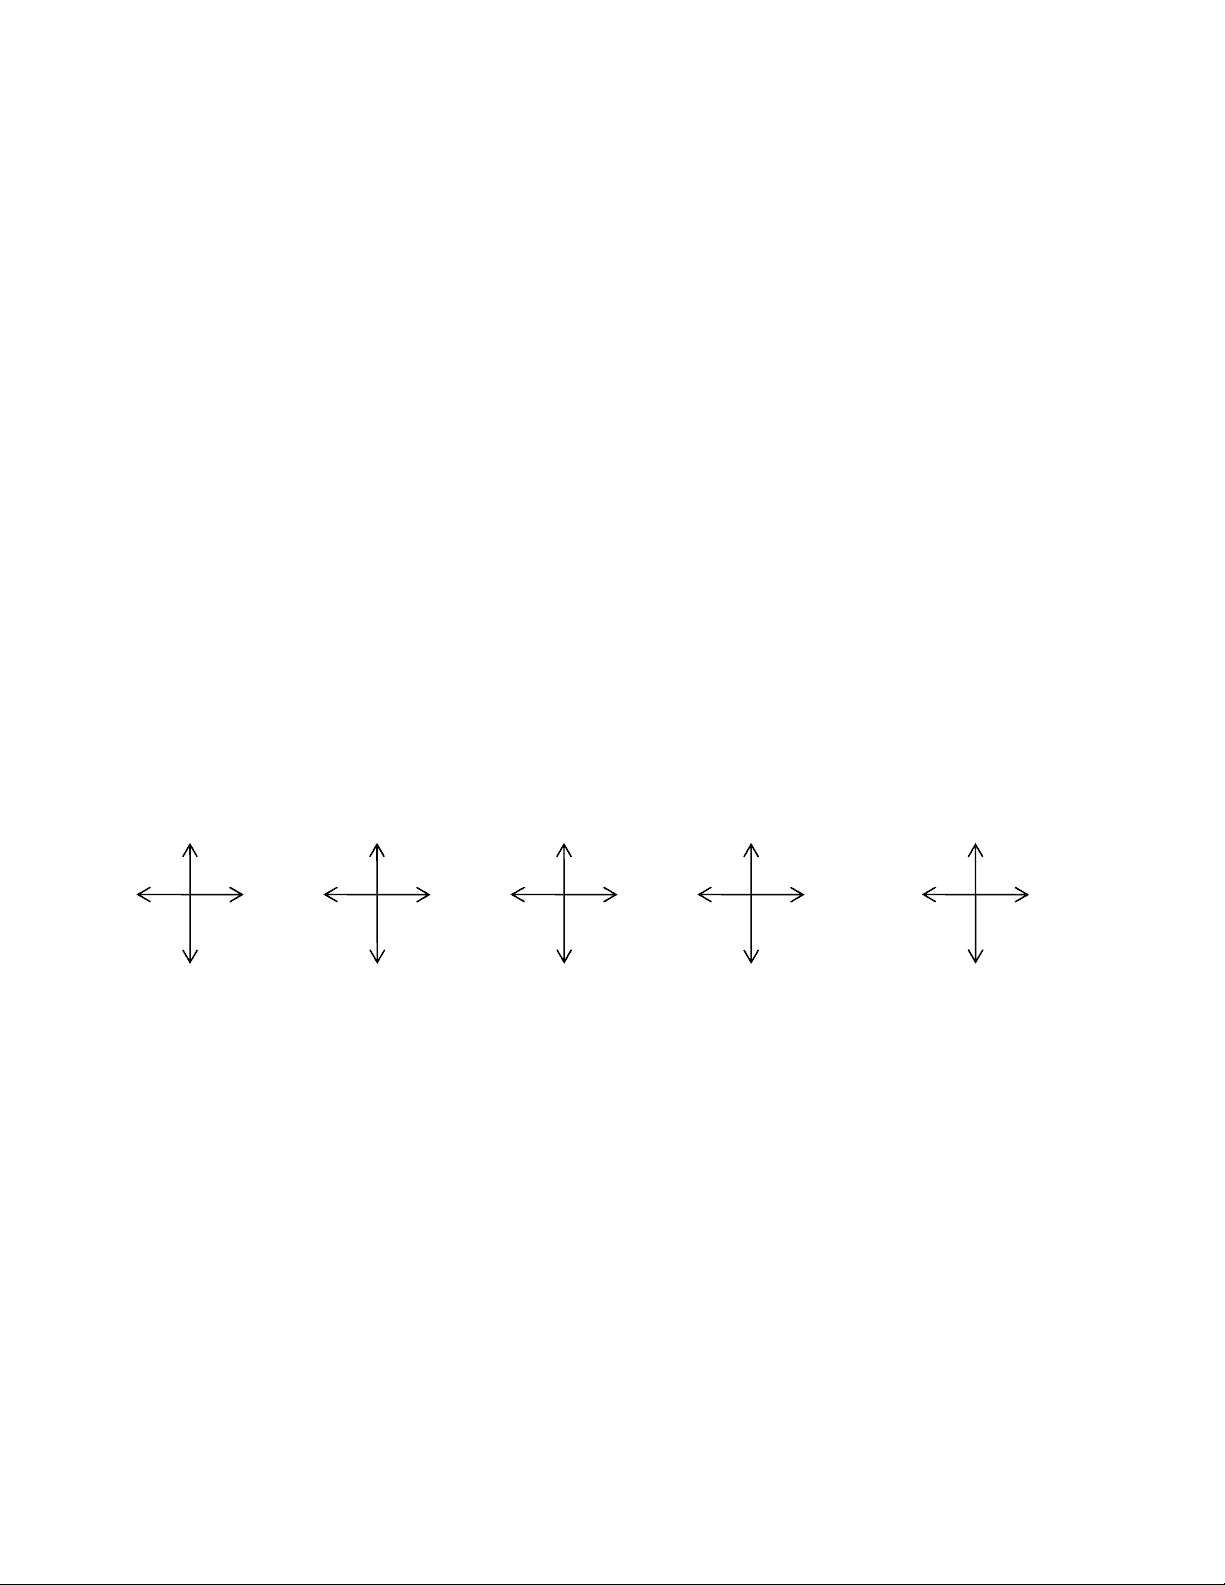
General Shape of graphs of polynomials ( )
n P x = x Degree 0 or 1 Degree 2 degree 3 Even Degree >2 Odd Degree > Remember Graphing by Translations?
(^4 2 5 4 ) a) P x = x − 3 , b) P x = 3 x − 4 − 1, c ) P x = x + x − x + 2 You know the general shapes, and how to translate or shift (a) and (b). We need to get a little more information for (c) to make a “nice” sketch. We first need a couple of tools to help us determine where the function is positive or negative and then the far-end behavior of the graph. These tools are the Intermediate Value Theorem for Polynomials and the Leading Term Test.
Intermediate Value Theorem for Polynomials: If P is a polynomial function and P a ( )and
P b ( )have opposite signs, then there exists at least one c between a and b for which
P c ( ) = 0.
Consequence of the theorem: Between any 2 successive zeros, the values of P x ( )are either
all positive (above the x-axis) or all negative (below the x-axis). Think about the sign graphs that we used for non-linear inequalities. End Behavior and the Leading Term Test: The end behavior of a polynomial is a description of what happens as x → ∞ ( x gets very large in the positive direction) or what happens as x → − ∞ ( x gets very large in the negative direction). End behavior is determined by the leading term,. n a xn
For any polynomial P x ( ):
CASE 1A: If n is an odd degree and an > 0 CASE 1B: If n is an odd degree and an < 0 Case 2A: If n is an even degree and an > 0 Case 2B: If n is an even degree and an < 0 Describe the end behavior for each of the following:
EX1: ( )
3
P x = − 5 x + 3 x − 9 EX2: ( )
6 4 P x = 8 x + 45 x − 9 x + 2
Ex: Use the guidelines to sketch the polynomial, ( )
3 2 P x = x − 2 x − x + 2. x y
Ex: Use the guidelines to sketch the polynomial, ( )
4 3 P x = x − 2 x + 8 x − 16. x y