Calibrating a Rubber Band:
Suppose we hang a bag of pennies from a rubber band. If we increase the number of pennies, we would
expect the length of the rubber band to increase.
Is there a (linear) relationship between the length of a rubber band and the number of pennies in a bag?
If so, can we use that relationship to calibrate the rubber band and use it as a device to count pennies or
weigh objects?
Data Collection:
Working in a small group of about 4 people, collect data by hanging a bag of pennies from a rubber band
and recording the length (in centimeters) of the rubber band versus the number of pennies hanging from
it. Start with 20 pennies and add 20 pennies at a time, up to about 100 pennies.
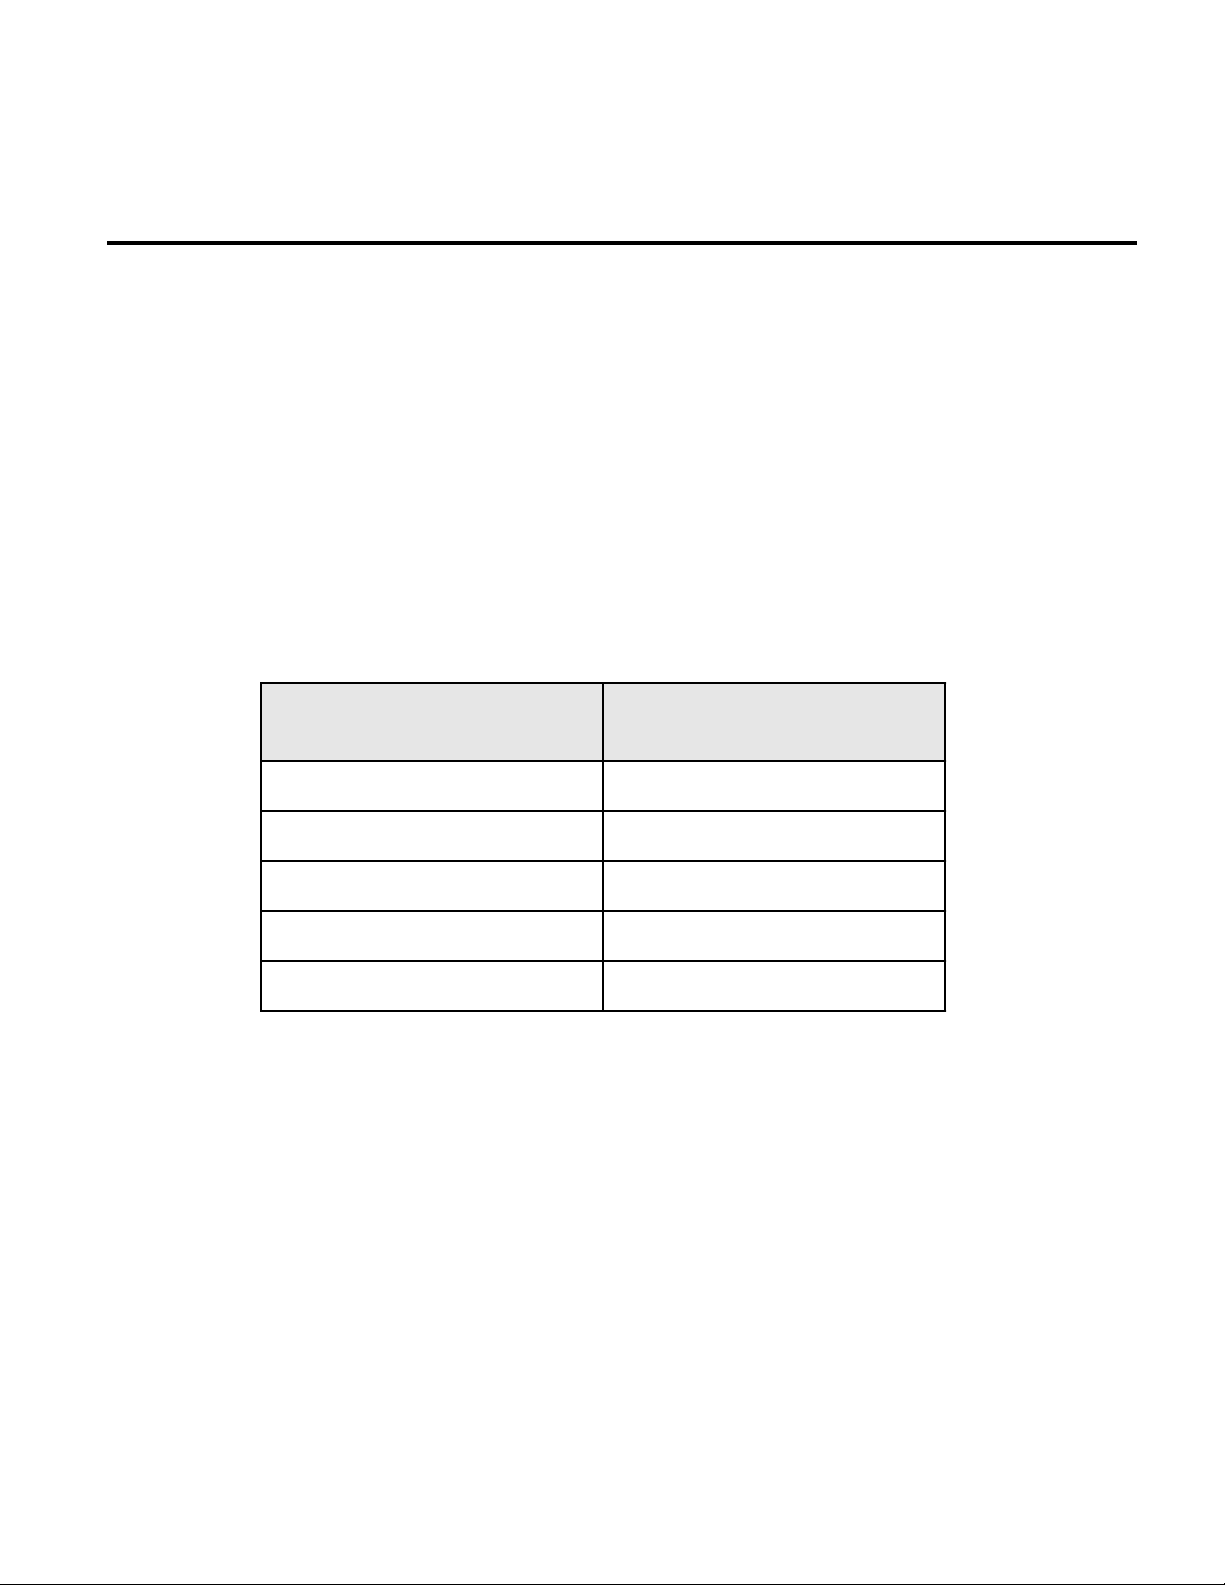
Number of Pennies
N
Length of Rubber Band
L (cm)
20
40
60
80
100
Scatter Plot and “Line of Best Fit” (Regression Line) – by Hand:
Plot your points on the graph paper on the next page, with number of pennies, N, on the horizontal axis
and length of rubber band, L, on the vertical axis. Sketch a line of best fit.
Using the “Line of Best Fit” to Estimate Number of Pennies – by Hand:
Put an unknown number of pennies in the bag, then measure and record the length of the rubber band.
Use the line you drew on the next page to determine (and record) the corresponding number of pennies.
How many pennies are predicted? Now count the pennies. How close was the predicted number to the
actual number?
Length = ____________ , Predicted # pennies = ____________ , Actual # pennies = ____________
.
Linear Models
!Rubber Band Length versus Number of Pennies!MA 104 10-1-09