Download Lab Experiments 5 for Acid-Base Titration - General College Chemistry I | CHE 111 and more Lab Reports Chemistry in PDF only on Docsity!
Experiment
Chemistry 111 – Aug 2008 5 - 1
Acid-Base Titration
A titration is a process used to determine the volume of a solution needed to react with a given amount of
another substance. In this experiment, you will titrate hydrochloric acid solution, HCl, with a basic sodium hydroxide solution, NaOH. The concentration of the NaOH solution is given and you will
determine the unknown concentration of the HCl. Hydrogen ions from the HCl react with hydroxide ions
from the NaOH in a one-to-one ratio to produce water in the overall reaction:
H+(aq) + Cl–(aq) + Na+(aq) +OH–(aq) → H 2 O(l) + Na+(aq) + Cl–(aq)
For a quantitative determination of the HCl concentration there must be a way to know when the titration
has reached the equivalence point. Because all of the reagents and products in this reaction are colorless,
an indicator will be added to signal when the titration has reached the equivalence point.
In this experiment we will simultaneously determine the equivalence point using an electronic
measurement of hydrogen ion concentration.
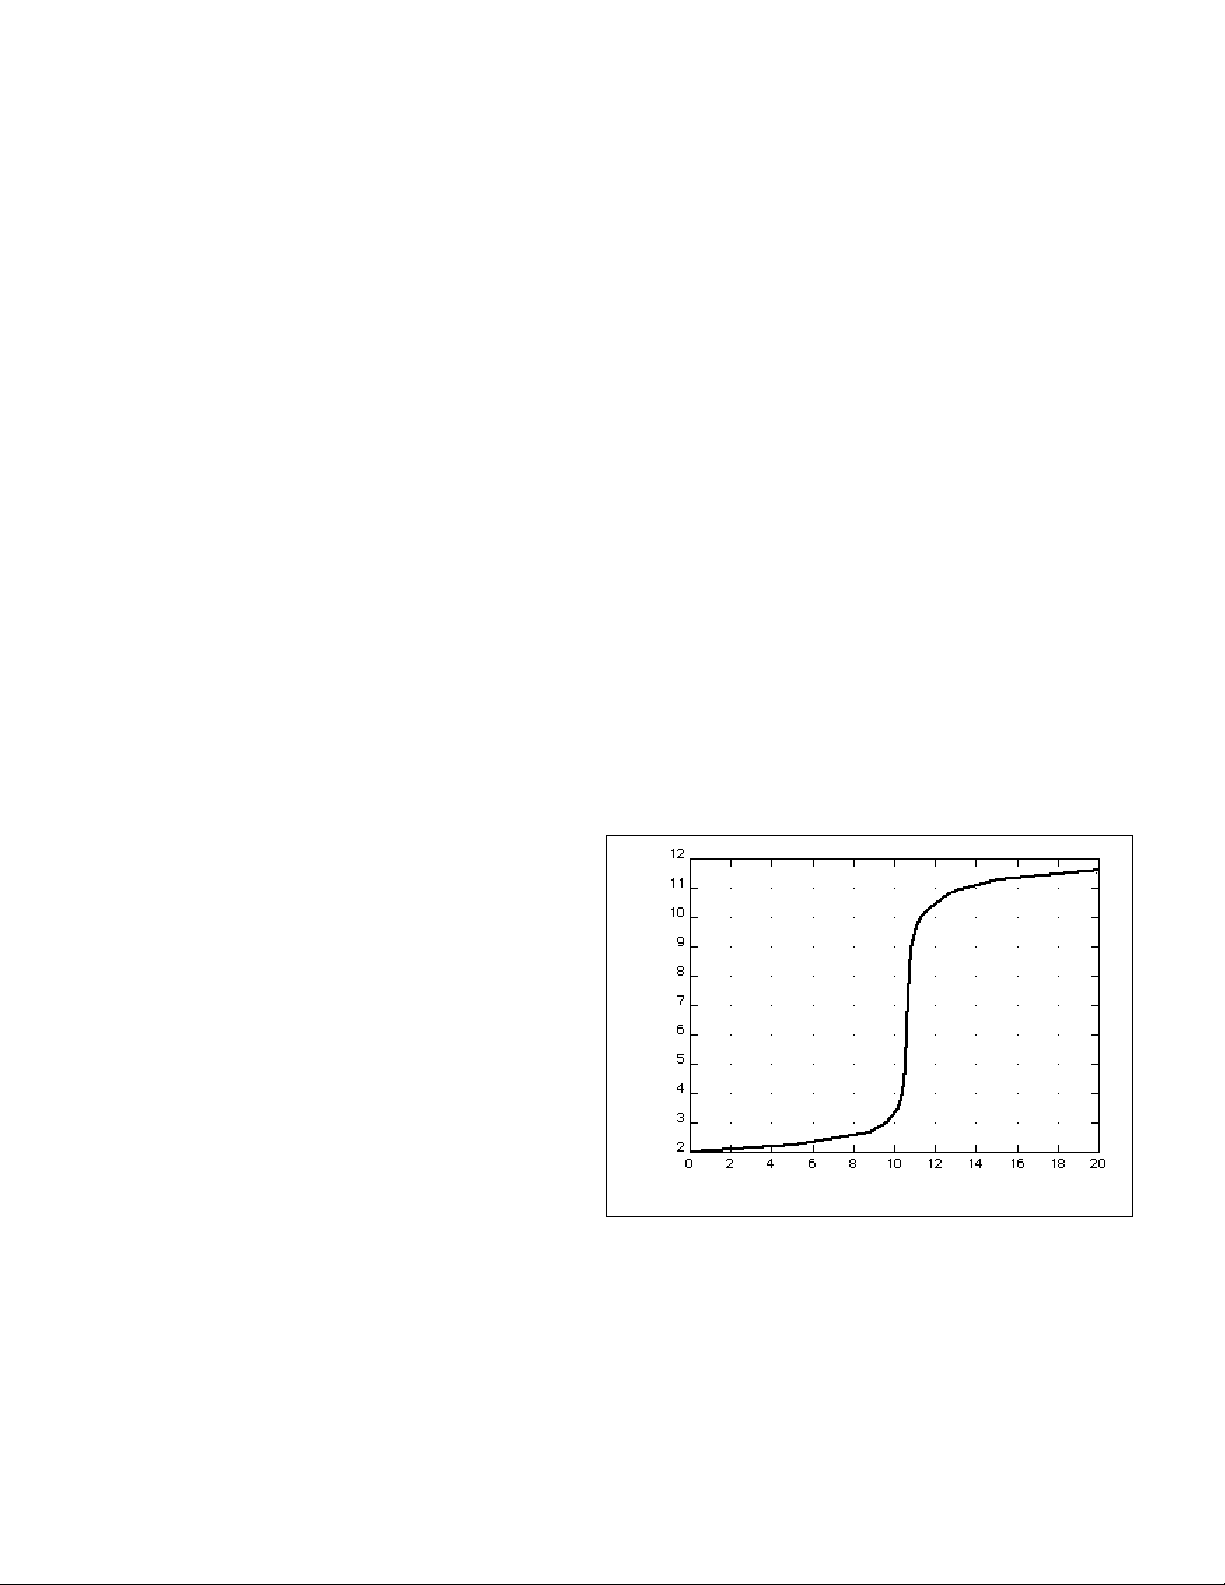
When an HCl solution is titrated with a NaOH solution, initially the acidity or concentration of acid is
very high. As base is added, the change in hydrogen ion concentration is quite gradual until close to the equivalence point, when equimolar amounts of acid and base have been mixed. Near the equivalence
point, the concentration of H+^ ions increases very rapidly, as shown in Figure 1. The change in hydrogen
ion concentration then becomes more gradual again, before leveling off with the addition of excess base. The equivalence point is indicated by the point at which the change in concentration is most rapid.
Note: Acidity or concentration of hydrogen ions
(written [H
]) is usually expressed as “pH”. The unit used for [H+] is pH = -log [H+]. (This is a
subject you will study in depth in CHE 112.)
For purposes of this experiment note that pH is inversely related to hydrogen ion concentration;
that is, as hydrogen ion concentration declines,
pH increases.
In this experiment, you will use a pH probe to
monitor H
ion concentration as you titrate and
the computer to record the data. The region of most rapid pH change will then be used to
determine the equivalence point. The volume of
NaOH titrant used at the equivalence point will be used to determine the molarity of the HCl.
Volume NaOH (mL)
pH
Experiment 5 Chemistry 111
5 - 2 Chemistry 111
OBJECTIVES
In this experiment, you will
- Use a pH Sensor to monitor changes in pH as sodium hydroxide solution is added to a hydrochloric acid solution.
- Plot a graph of pH vs. volume of sodium hydroxide solution added.
- Use the graph, and the change in color of an indicator, to determine the equivalence point of the titration.
- Use the results to calculate the concentration of the hydrochloric acid solution.
MATERIALS
Computer magnetic stirrer (if available) Vernier computer interface stirring bar or Microstirrer (if available) Logger Pro wash bottle Vernier pH Sensor distilled water HCl solution, unknown concentration ring stand 0.100 M NaOH solution 1 utility clamp pipet bulb (^) 2 x 250 mL beaker 25 mL buret 10 mL pipet
PROCEDURE
- Obtain and wear goggles.
- Add 50 mL of distilled water to a 250 mL beaker. Use a pipet bulb to pipet 10.0 mL of the HCl solution into the distilled water in the 250 mL beaker. CAUTION: Handle the hydrochloric acid with care. It can cause painful burns if it comes in contact with the skin.
- Place the beaker on a magnetic stirrer and add a stirring bar. If no magnetic stirrer is available, you need to stir with a stirring rod during the titration.
- Use a utility clamp to suspend a pH Sensor on a ring stand as shown here. Position the pH Sensor in the HCl solution and adjust its position so it will not be struck by the stirring bar. Turn on the magnetic stirrer, and adjust it to a medium stirring rate (with no splashing of solution).
- Obtain approximately 30 mL of ~0.1 M NaOH solution in a 50 or 100 mL beaker. Obtain a 25 mL buret and rinse the buret with a few mL of the ~0.1 M NaOH solution. Use a utility clamp to attach the buret to the ring stand as shown here. Fill the buret a little above the 0.00 mL level of the buret with ~0.1 M NaOH solution. Drain a small amount of NaOH solution into the NaOH beaker so it fills the buret tip and leaves the NaOH at the 0.00 mL level of the buret. Record the precise concentration of the NaOH solution in your data table. Dispose of the waste solution from this step by washing it down the sink drain followed by a generous quantity of tap water. CAUTION: Sodium hydroxide solution is caustic. Avoid spilling it on your skin or clothing.
- Connect the pH Sensor to the computer interface. Prepare the computer for data collection by opening the file “CHE 111 Acid-Base Titration” from the Chemistry with Computers folder. Check to see that the pH value is between 2 and 3. Add two drop of phenolphthalein indicator to the beaker.
Experiment 5 Chemistry 111
5 - 4 Chemistry 111
DATA TABLE
Trial 1 Trial 2
Concentration of NaOH M M
NaOH volume added before the largest pH increase mL mL
NaOH volume added after the largest pH increase mL mL
Volume of NaOH added at equivalence point mL mL
Volume of NaOH added at end point (Where indicator changes color.)
mL mL
Moles NaOH
mol mol Moles HCl
mol mol Concentration of HCl
mol/L mol/L Average [HCl] M
EQUIVALENCE POINT DETERMINATION: An Alternate Method
An alternate way of determining the precise equivalence point of the titration is to take the first and second derivatives of the pH-volume data. The equivalence point volume corresponds to the peak (maximum) value of the first derivative plot, and to the volume where the second derivative equals zero on the second derivative plot.
View the first-derivative graph (∆pH/∆vol) by clicking the on the vertical-axis label (pH), and choose First Derivative. You may need to autoscale the new graph by clicking the Autoscale button,. View the second-derivative graph (∆ 2 pH/∆vol 2 ) by clicking on the vertical-axis label, and choosing Second Derivative.
Chemistry 111 Acid-Base Titration
Chemistry 111 5 - 5
POST-LAB NAME: ___________________________________
- Explain how the results would be affected by the following poor techniques. Would your calculated
concentration for the unknown acid be too high or too low?
a. One drop of NaOH solution hit the side of the beaker and spilled out.
b. When using the pipette to introducing 10 mL of HCl solution, you blew out the last bit of solution.
c. You failed to wash down the sides of the beaker so drops of solution remained on the sidewalls.
- What is the difference between the volumes of NaOH solution at the equivalence point and that at the
end point? Would your result be affected by use of the end point value? Calculate the percent error introduced by this difference.
- If 20.00 mL of an unknown solution of HCl was titrated with 0.10 M NaOH and 18.5 mL were
required to reach the equivalence point, what is the concentration of acid in the unknown?