Download Statistical Analysis and Probability: Homework 1 for Math 3339 - Spring 2024 and more Assignments Mathematical Statistics in PDF only on Docsity!
a An Introduction to Statistical Learning, James, G. et al (2013), Chapter 2
b
Math 3339 – Spring 2024
Homework 1 (Chapter 1 & Chapter 3)
Name:__________________________________ PeopleSoft ID:_______________
Instructions:
Homework will NOT be accepted through email or in person. Homework must be submitted through
CANVAS BEFORE the deadline.
Total possible points: 100
a
This exercise relates to the College data set, which can be found in the file College.csv. It contains a
number of variables for 777 different universities and colleges in the US. Identify the types of the
following variables.
Private : Public/private indicator
F.Undergrade : Number of full-time undergraduates
S.F.Ratio : Student/faculty ratio
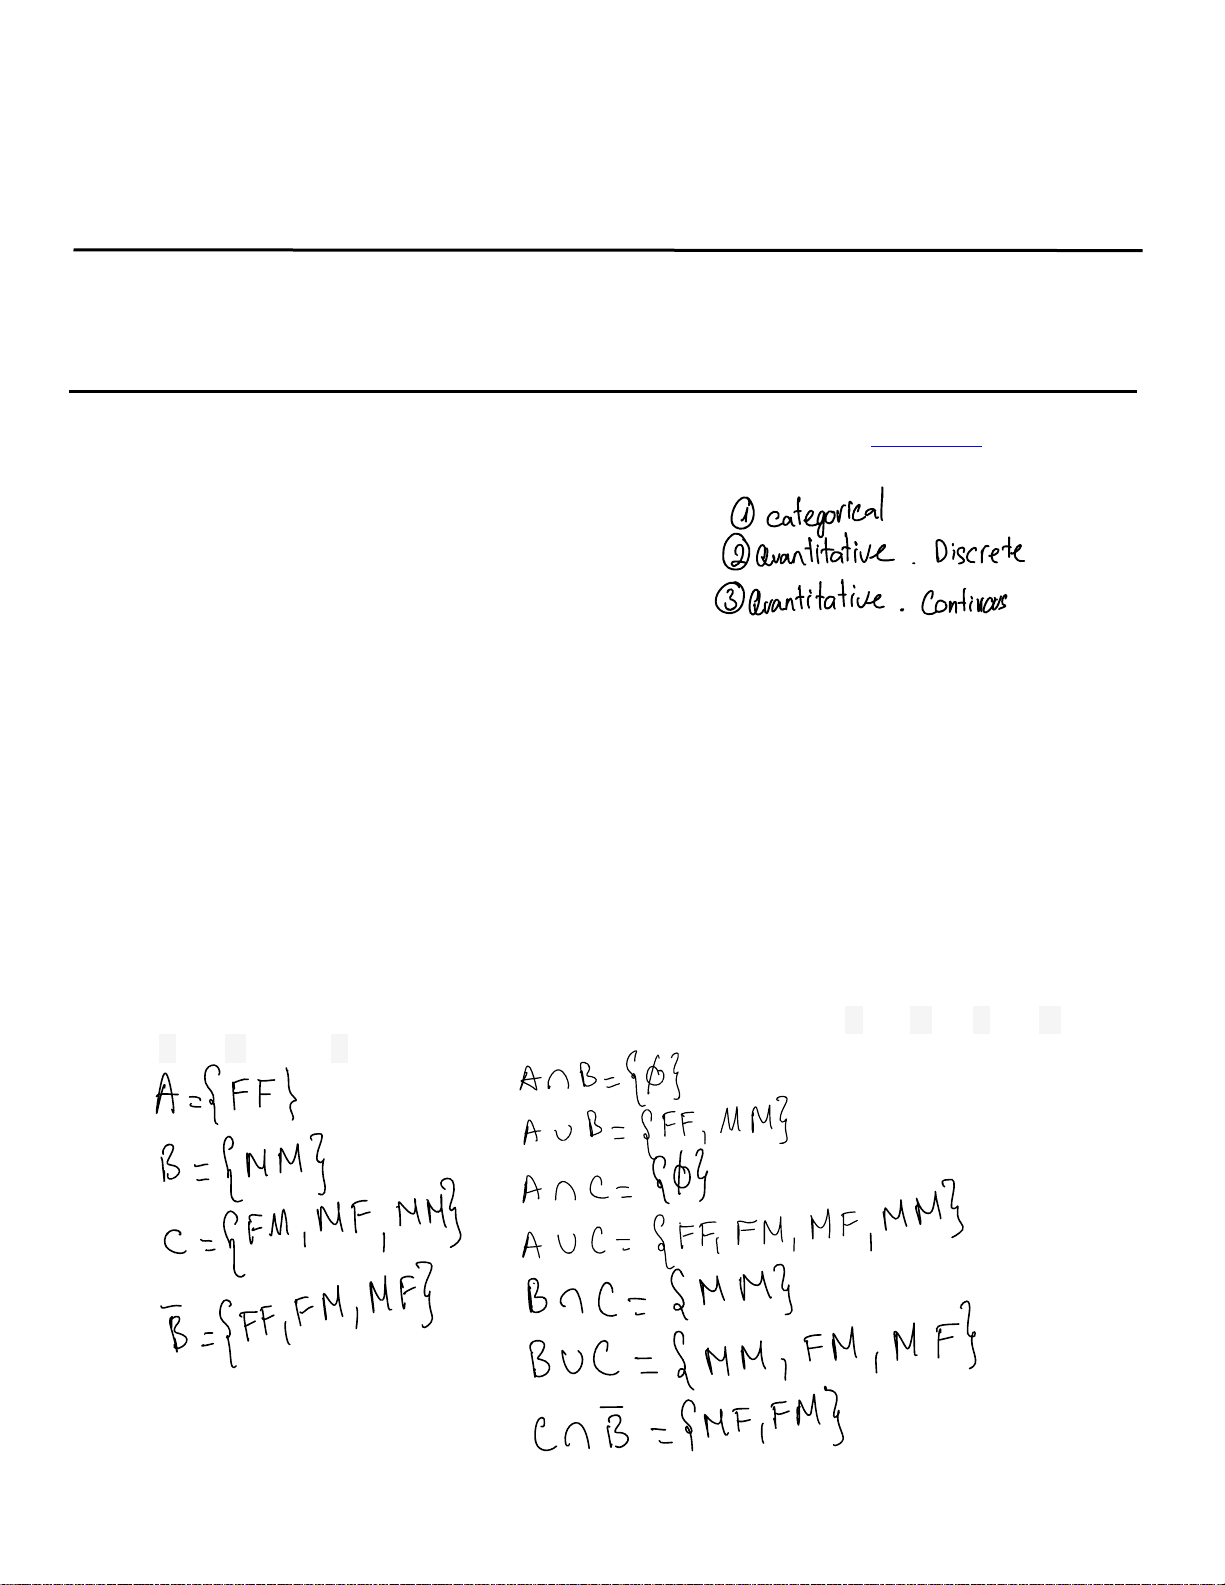
b Suppose a family contains two children of different ages, and we are interested in the gender of these
children. Let F denote that a child is female and M that the child is male and let a pair such as FM
denote that the older child is female and the younger is male. There are four points in the set S of
possible observations:
S = { FF, FM, MF, MM }
Let A denote the subset of possibilities containing no males; B , the subset containing two males; and
C, the subset containing at least one male. List the elements of A , B , C , A ∩ B , A ∪ B , A ∩ C , A ∪ C,
B ∩ C , B ∪ C, and C ∩ 𝐵
Andy (^) Nguyen 2339395
categorical
Quantitative Discrete
Quantitative Continous
A
FF
AND
90
β
MM
AUB
FF MM
C
FM
MF
MM
Anc
0
AUC
FF FM^
MF
MM
B
FFFM
MF BMC
MM
BUC MM
FM MF
CAB
SMF
FM
a An Introduction to Statistical Learning, James, G. et al (2013), Chapter 2
b
- The “Boston” data set is a built-in dataset in the “MASS” library of R. The “Boston” data set contains
information about the housing values in suburbs of Boston city. First, load the “Boston” data set into
your R workspace. In Rstudio, you can click on the “Packages” tab and then on the checkbox next to
MASS. Without Rstudio, type the following command in R console:
data(Boston,package=”MASS”)
To know more information about this dataset, type the following command in R console:
?Boston
Then, answer the following questions based on the dataset, using R/Rstudio:
a. How many rows and columns in this data set?
b. How many of the suburbs in this dataset bound the Charles River? (Hint: Variable chas is a
dummy variable; chas =1 means tract bounds river, 0 otherwise) You can obtain a list of suburbs
bound the Charles River with the command:
subset(Boston,chas==1)
You can obtain a count of the suburbs bound the Charles River by
sum(Boston$chas==1)
c. What is the probability that you randomly select a suburb that bounds the Charles River?
806 rows
14
columns
35
P
suburb andcharles River
1135
a An Introduction to Statistical Learning, James, G. et al (2013), Chapter 2
b
- An organization is planning a raffle to sell 40 tickets. Each customer can only buy one ticket. There
are three prizes to be awarded. If each of the five organizers of the raffle buy one ticket, find out the
following probabilities:
a. The five organizers win all the prizes.
b. The five organizers win exactly one of the prizes.
c. The five organizers win none of the prizes.
- Suppose that A and B are two events such that P ( A )=0.7, and P ( B )=0.2.
a. Is it possible that P ( A ∩ B) = 0.1?
b. What is the smallest possible value for P ( A ∩ B)? Why?
c. Is it possible that P ( A ∩ B) = 0.8? Why or why not?
d. What is the largest possible value for P ( A ∩ B)?
a
chose.fi
fIc
b
II
cho
c
If
chose.fi
c ff1I
A
when
A Bare^
independent
event
PLAN
B P A
PB 0.2 0.7 0.19^ a
when
A Bare
disjoint P
AAB 0
2
From
1 a^
impossible
P AAB^ 0.
b when A B^
are disjoint
smallest value is
O
c
No it is
notpossible^
P AAB^
cannot (^) be greater
than 0.
d
The
largest
possible
value
for
P ARB^ isthe
smaller
of
PCA and PB
In this
case
it is 0.
a An Introduction to Statistical Learning, James, G. et al (2013), Chapter 2
b
- A certain company sends 50% of its overnight mail parcels via express mail service E1. Of these
parcels, 1% arrive after the guaranteed delivery time (denote the event late delivery by L). Suppose
that 10% of the overnight parcels are sent via express mail service E2 and the remaining 40% are sent
via E3. Of those sent via E2 only 2% arrive late, whereas 5% of the parcels handled by E3 arrive late.
a. Draw a tree diagram for this problem.
b. If a record of an overnight mailing is randomly selected from the company’s file, what is the
probability that the parcel went via E2 and was late?
c. What is the probability that a randomly selected parcel arrived on time?
d. If a randomly selected parcel has arrived late, what is the probability that is was not sent via E1?
b (^) P
EML
P
C
P
C
PENE
P
L n (^) E P LINE
0.99 0.50 0.950.40 (^) 0. 0 I
a.ie
iiiiiiI
ii
d
reins
go.fi
ff
n
foot
XO
(^0 )