Docsity
Docsity

Prepare for your exams

Study with the several resources on Docsity


Earn points to download

Earn points by helping other students or get them with a premium plan


Guidelines and tips
Guidelines and tips

Graphing Polar Equations and Parametric Equations Involving Trigonometric Functions - Prof, Study Guides, Projects, Research of Trigonometry

Instructions for completing project 4 in mac 1114 trigonometry, which involves graphing polar equations and parametric equations using a graphing calculator. Students are required to adjust the theta maximum value, amplitude, period, and phase shift to observe the effects on the graphs. They are also encouraged to experiment with different constants and trigonometric functions to create interesting designs.

Typology: Study Guides, Projects, Research

Pre 2010

Uploaded on 08/19/2009

koofers-user-5xd
koofers-user-5xd 🇺🇸

5

(2)

10 documents

1 / 3

Toggle sidebar

This page cannot be seen from the preview

Don't miss anything!

bg1
MAC 1114 Trigonometry
Project 4
Graphing Polar Equations Involving Trigonometric Functions
Use a graphing calculator to complete the following. Display your graphs on the provided paper.
Part 1: Adjusting the θmaxmax
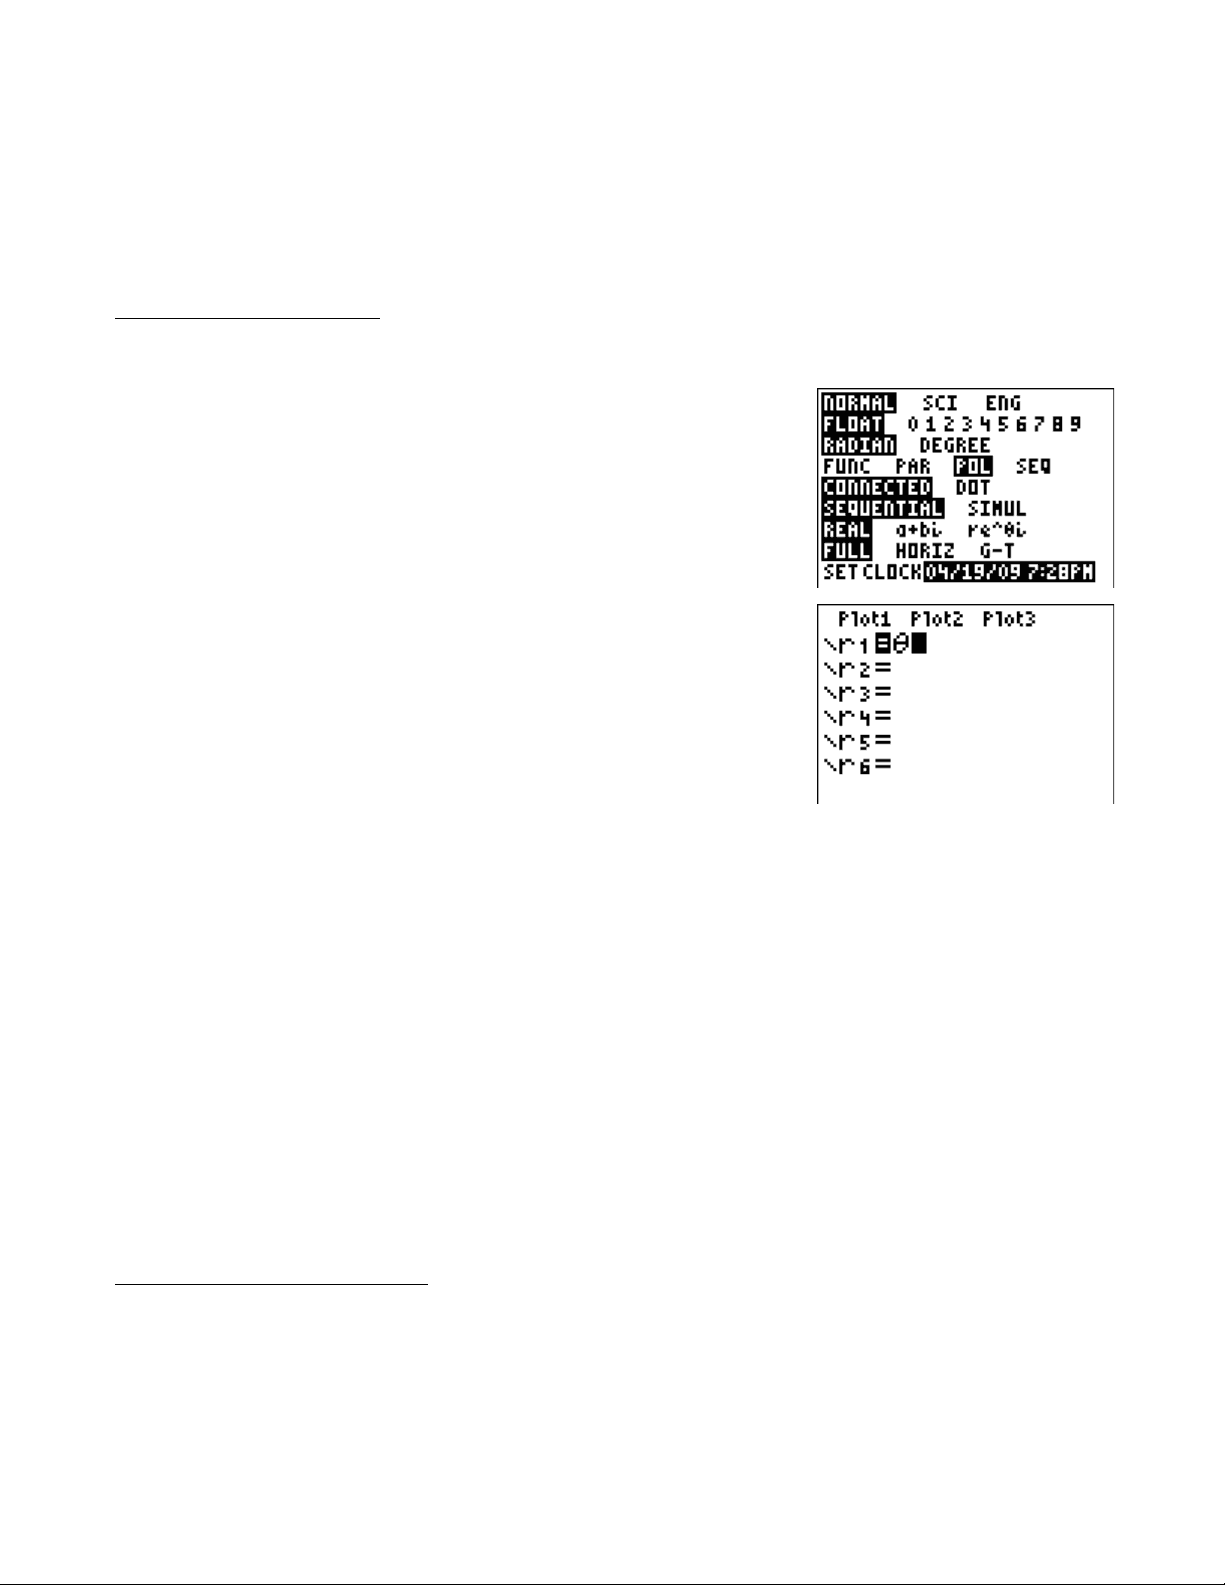
1) Press the mode key and select pol for type of equation.
2) Press the y = key and enter θmax for r1.
3) Select ZTrig under the Zoom key and graph the equation.
Use Zoom/Fit and Zoom/Square to adjust the size of the graph.
4) Select Window and set θmaxmax to 4π. Use Zoom/Fit and Zoom/Square to adjust the size of the graph.
Graph the equation.
5) Use the trace and arrow keys to identify points around the circle. Identify the points and
angles in radians. Explain the relationship between θmax and sin θmax and cos θmax. Set the step to π/12.
__________________________________________________________________________________
__________________________________________________________________________________
__________________________________________________________________________________
6) Select Window and set θmaxmax to 5π. Use Zoom/Fit and Zoom/Square to adjust the size of the graph.
Graph the equation. How many spirals are graphed?
Part 2: Changing the Amplitude
7) Press the y = key and enter θmax for r1 and enter 2θmax for r2. Change the θmaxmax to 2π.
5) Graph the equations. Use Zoom/Fit and Zoom/Square to adjust the size of the graph.
9) Change the constant in front of θmax and set θmaxmax to 40. Generalize how changing the graph effects the
graph.
1
pf3

Partial preview of the text

Download Graphing Polar Equations and Parametric Equations Involving Trigonometric Functions - Prof and more Study Guides, Projects, Research Trigonometry in PDF only on Docsity!

MAC 1114 Trigonometry Project 4 Graphing Polar Equations Involving Trigonometric Functions Use a graphing calculator to complete the following. Display your graphs on the provided paper. Part 1: Adjusting the θmaxmax

  1. Press the mode key and select pol for type of equation.
  2. Press the y = key and enter θmax for r1.
  3. Select ZTrig under the Zoom key and graph the equation. Use Zoom/Fit and Zoom/Square to adjust the size of the graph.
  4. Select Window and set θmaxmax to 4π. Use Zoom/Fit and Zoom/Square to adjust the size of the graph. Graph the equation.
  5. Use the trace and arrow keys to identify points around the circle. Identify the points and angles in radians. Explain the relationship between θmax and sin θmax and cos θmax. Set the step to π/12.


  1. Select Window and set θmaxmax to 8π. Use Zoom/Fit and Zoom/Square to adjust the size of the graph.π. Use Zoom/Fit and Zoom/Square to adjust the size of the graph. Graph the equation. How many spirals are graphed? Part 2: Changing the Amplitude
  2. Press the y = key and enter θmax for r 1 and enter 2θmax for r2. Change the θmaxmax to 2π. 8π. Use Zoom/Fit and Zoom/Square to adjust the size of the graph.) Graph the equations. Use Zoom/Fit and Zoom/Square to adjust the size of the graph.
  3. Change the constant in front of θmax and set θmaxmax to 40. Generalize how changing the graph effects the graph.

MAC 1114 Trigonometry Project 4 Graphing Parametric Equations Involving Trigonometric Functions Part 3: Trigonometric Functions and Polar Equations (Changing the Period)

  1. Press the y = key and enter sin θmax for r1. Set the step to π/36 and θmaxmax to 2π.
  2. Graph the equations. Use Zoom/Fit and Zoom/Square to adjust the size of the graph.
  3. Press the y = key and enter sin 2θmax for r1. Graph the equations.
  4. Press the y = key and enter sin 3θmax for r1. Graph the equations.
  5. How does changing the period effect the graph?
  6. Repeat steps 10 – 14 for cos, tan, sec, csc, and cot. (adjust range values to 1.5 units around zero). Part 4: Changing the Phase Shift
  7. Press the y = key and enter sin(θmax) for r 1 and sin(θmax – π/2) for r2.
  8. Graph the equations. Use Zoom/Fit and Zoom/Square to adjust the size of the graph. 18π. Use Zoom/Fit and Zoom/Square to adjust the size of the graph.) Press the y = key and enter sin(θmax) for r 1 and sin(θmax – 2π) for r2.
  9. How does changing the phase shift effect the graph? Part 5: Changing the Translation Numbers
  10. Press the y = key and enter sin(θmax) + 1 for r1.
  11. Graph the equations. Use Zoom/Fit and Zoom/Square to adjust the size of the graph.
  12. Press the y = key and enter sin(θmax) + 2 for r2.
  13. Press the y = key and enter 2sin(θmax) + 1 for r 1 and 3sin (θmax) + 1 for r2.
  14. How does changing the constants effect the graph?
  15. Enter 3sin(3θmax) + 1 for r 1 and 3sin (θmax) + 1 for r2. Graph the equations.
  16. Change the constants and trig functions to create some interesting designs. Try to predict the outcomes before you graph them.