Docsity
Docsity

Prepare for your exams

Study with the several resources on Docsity


Earn points to download

Earn points by helping other students or get them with a premium plan


Guidelines and tips
Guidelines and tips

Statistics Exam Review: Final Exam Preparation for Statistics 1300, Exams of Statistics

Information about a statistics 1300 final exam review session, including the date, time, and location. It also includes various statistical problems for students to work on in preparation for the exam. Topics covered include regression analysis, correlation coefficients, relative frequency histograms, and probability distributions.

Typology: Exams

Pre 2010

Uploaded on 08/18/2009

koofers-user-bqt
koofers-user-bqt 🇺🇸

10 documents

1 / 3

Toggle sidebar

This page cannot be seen from the preview

Don't miss anything!

bg1
Learning Center’s
Statistics 1300
Final Exam Review
Middlebush Room 12
Friday, May 8, 2009
2:00 – 4:00 p.m.
Note 1: In addition to these review problems, I would advise students to work through problems from the sample
finals posted on Blackboard.
Note 2: There will be a Q&A session on Tuesday, May 12 from 12:00 to 1:30 p.m. in Middlebush 206.
1. A student’s final grade can sometimes be affected in a negative way by missing too many classes throughout a
semester. To analyze the notion that the more days a student misses (x), the lower your final grade (y, in
percentage), the data below were collected from a random sample of 10 students.
x 2 1 10 5 25 12 7 40 22 0
y 84 95 85 75 54 58 81 70 62 91
22
124, 755, 3032, 58797, 8265xyx y xyΣ= Σ= Σ = Σ = Σ =
a) Find the equation of the least squares line.
b) What final grade percentage should be predicted for a student who misses 9 classes?
c) Find the sample correlation coefficient.
d) Assuming that, for each value of x, the corresponding y’s have the same variance, find the estimate for this
common variance.
2. Six subjects were selected at random, and the age and systolic blood pressure for each was recorded. Their ages
ranged from 43 to 70, and their blood pressures ranged from 120 to 152. Using this data, Minitab produced the
regression analysis output that is given below.
Regression Analysis: Pressure versus Age
The regression equation is
Pressure = 81.0 + 0.964 Age
Predictor Coef SE Coef T P
Constant 81.05 13.88 5.84 0.004
Age 0.9644 0.2381 4.05 0.015
S = 5.641 R-Sq = 80.4% R-Sq(adj) = 75.5%
Analysis of Variance
Source DF SS MS F P
Regression 1 522.21 522.21 16.41 0.015
Residual Error 4 127.29 31.82
Total 5 649.50
a) If we test the hypothesis 01
:0H
β
= against 1
:0
A
H
β
, what is the p-value for the test?
b) Using .05
α
=, what would we conclude for the test in (a)?
c) If we test the hypothesis that blood pressure tends to increase with age, what is the p-value for the test?
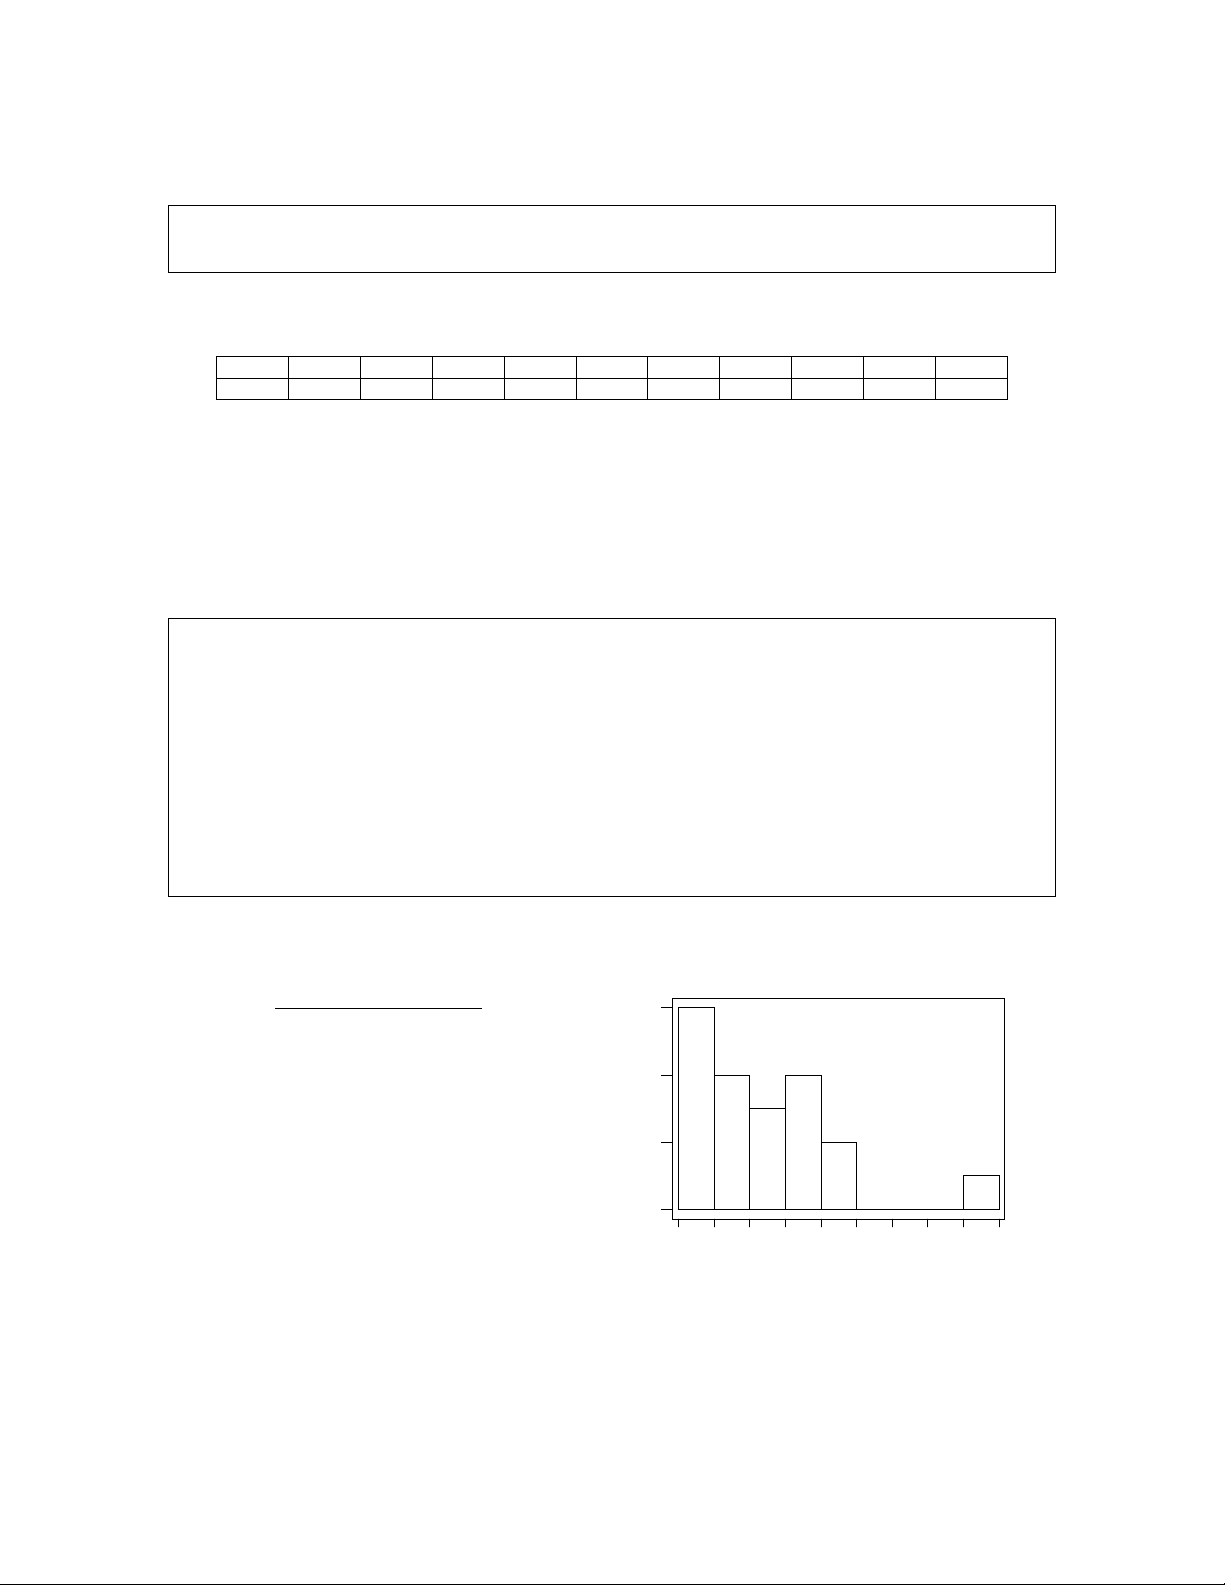
3. Use the relative frequency histogram at the right
to answer the following questions. Read all
relative frequencies to the nearest 5%.
a) If there are 80 observations in the data set, how
many observations are between 30 and 50?
b) Find the median.
c) Based on the histogram, which should be larger,
the mean or the median? Why?
4. Find the standard deviation of the following
data set: {1, 4, 5, 9}.
9080706050403020100
30
20
10
0
C
1
Percent
5. Of the members of a particular Poker club, 60% play Hold ‘em regularly, 55% play Seven Card Stud regularly,
and 30% play both Hold ‘em and Seven Card Stud regularly.
a) If members are selected at random, what is the probability that he or she will play either Hold ‘em or Seven Card
Stud regularly?
b) Are the events “plays Hold ‘em regularly” and “plays Seven Card Stud regularly” independent? Explain.
c) Are the events “plays Hold ‘em regularly” and “plays Seven Card Stud regularly” mutually exclusive? Explain.
6. Suppose that 20% of professional comedians quit performing by the time they are 40 years of age.
a) If 15 professional comedians are selected at random, what is the probability that at least 5 will quit by age 40?
b) If 16 professional comedians are selected at random, what is the probability that exactly 2 will quit by age 40?
pf3

Partial preview of the text

Download Statistics Exam Review: Final Exam Preparation for Statistics 1300 and more Exams Statistics in PDF only on Docsity!

Learning Center’s

Statistics 1300

Final Exam Review

Middlebush Room 12

Friday, May 8, 2009

2:00 – 4:00 p.m.

Note 1: In addition to these review problems, I would advise students to work through problems from the sample finals posted on Blackboard. Note 2: There will be a Q&A session on Tuesday, May 12 from 12:00 to 1:30 p.m. in Middlebush 206.

  1. A student’s final grade can sometimes be affected in a negative way by missing too many classes throughout a semester. To analyze the notion that the more days a student misses (x), the lower your final grade (y, in percentage), the data below were collected from a random sample of 10 students. x 2 1 10 5 25 12 7 40 22 0 y 84 95 85 75 54 58 81 70 62 91 Σ x = 124, Σ y = 755, Σ x^2 = 3032, Σ y 2 = 58797, Σ xy = 8265

a) Find the equation of the least squares line. b) What final grade percentage should be predicted for a student who misses 9 classes? c) Find the sample correlation coefficient. d) Assuming that, for each value of x, the corresponding y’s have the same variance, find the estimate for this common variance.

  1. Six subjects were selected at random, and the age and systolic blood pressure for each was recorded. Their ages ranged from 43 to 70, and their blood pressures ranged from 120 to 152. Using this data, Minitab produced the regression analysis output that is given below. Regression Analysis: Pressure versus Age The regression equation is Pressure = 81.0 + 0.964 Age

Predictor Coef SE Coef T P Constant 81.05 13.88 5.84 0. Age 0.9644 0.2381 4.05 0.

S = 5.641 R-Sq = 80.4% R-Sq(adj) = 75.5%

Analysis of Variance Source DF SS MS F P Regression 1 522.21 522.21 16.41 0. Residual Error 4 127.29 31. Total 5 649.

a) If we test the hypothesis H 0 : β 1 = 0 against HA : β 1 ≠ 0 , what is the p -value for the test?

b) Using α = .05, what would we conclude for the test in (a)?

c) If we test the hypothesis that blood pressure tends to increase with age, what is the p -value for the test?

  1. Use the relative frequency histogram at the right to answer the following questions. Read all relative frequencies to the nearest 5%.

a) If there are 80 observations in the data set, how many observations are between 30 and 50? b) Find the median. c) Based on the histogram, which should be larger, the mean or the median? Why?

  1. Find the standard deviation of the following data set: {1, 4, 5, 9}. (^0102030405060708090)

30

20

10

0

C 1

Percent

  1. Of the members of a particular Poker club, 60% play Hold ‘em regularly, 55% play Seven Card Stud regularly, and 30% play both Hold ‘em and Seven Card Stud regularly. a) If members are selected at random, what is the probability that he or she will play either Hold ‘em or Seven Card Stud regularly? b) Are the events “plays Hold ‘em regularly” and “plays Seven Card Stud regularly” independent? Explain. c) Are the events “plays Hold ‘em regularly” and “plays Seven Card Stud regularly” mutually exclusive? Explain.
  2. Suppose that 20% of professional comedians quit performing by the time they are 40 years of age. a) If 15 professional comedians are selected at random, what is the probability that at least 5 will quit by age 40? b) If 16 professional comedians are selected at random, what is the probability that exactly 2 will quit by age 40?

x 1 2 3 4 5 p(x) 0.2 0.3 0.3 0.1 0.

  1. Find the expected value and variance of the probability distribution at the right.
  2. Scores from a statistics exam are normally distributed with a mean of 78 and a standard deviation of 6. a) What is the probability that a randomly selected student (who took that particular exam) will score above an 88? b) How high a score would a person need to be in the top 15% on this particular exam?
  3. In a random sample of 200 Mizzou football fans, 160 said they were already excited about next year’s season of Tiger football. a) Find a 95% Confidence Interval for the true proportion of Mizzou football fans that are excited about the upcoming football season. b) To estimate the true proportion of Mizzou fans that are excited about the upcoming football season to within 0. with 95% confidence, what sample size is needed?
  4. A random sample of 9 trips by a professor to the beautiful Isle of Capri casino yielded mean winnings of $22 with a standard deviation of $15. a) Find a 90% confidence interval for the professor’s average winnings. b) Based on the 90% confidence interval, should we be confident that the professor wins more than $15 on an average visit? Explain.
  5. A random sample of 100 brand new Firestone tires has 13 defective tires, and a random sample of 120 brand new Goodyear tires yields 9 that are defective. a) Using α = 0.05, conduct a test to determine if the proportion of defective tires is different for the two brands. What should you conclude? b) Find the p-value of the test. Based on the p -value, what should you conclude? c) Using the same data, Minitab produced the output below. Does this output contradict the findings from parts a and b above? Explain. Test and CI for Two Proportions

Sample X N Sample p 1 13 100 0. 2 9 120 0.

Difference = p (1) - p (2) Estimate for difference: 0. 95% CI for difference: (-0.0260280, 0.136028) Test for difference = 0 (vs not = 0): Z = 1.35 P-Value = 0.

Fisher's exact test: P-Value = 0.

  1. To decide whether a new type of bumper performs better in low-speed crashes, 6 cars with the new bumpers and 6 cars with the old bumper design were each randomly selected and crashed into a concrete wall at a speed of 5 miles per hour. The cost of repairing the damages is given in the table below. Your assistant did not know whether you wanted to look at each sample separately or at paired differences, so he did calculations both ways.

New 127 168 143 165 122 139 x = 144 s =19.

Old 169 150 147 186 168 164 x = 164 s =14.

Difference − 42 18 − 4 − 21 − 46 − 25 x = − 20 s =24.

a) Decide what kind of test would be appropriate, and carry it out at the .05 level of significance. You may assume equal variances. b) Find the p -value for the test as accurately as possible. Would your conclusion in (a) be different if the level of significance was .01? Explain. c) With the same data, your assistant used Minitab to obtain the results below. Do his results contradict your findings in a and b above? Explain. Two-Sample T-Test and CI: New, Old Two-sample T for New vs Old

N Mean StDev SE Mean New 6 144.0 19.1 7. Old 6 164.0 14.2 5.

Difference = mu (New) - mu (Old) Estimate for difference: -20. 95% CI for difference: (-41.63, 1.63) T-Test of difference = 0 (vs not =): T-Value = -2.06 P-Value = 0.066 DF = 10 Both use Pooled StDev = 16.