Download Faraday's Law - Introduction to Laboratory II | PHYS 296 and more Lab Reports Astronomy in PDF only on Docsity!
Faraday’s Law
PHYS 296/Spring 2007
Your name___________ Lab section_______________ __
PRE-LAB QUIZZES
- What is the purpose of this lab?
- W hat is the magnetic flux?
- State and explain Faraday’s Law.
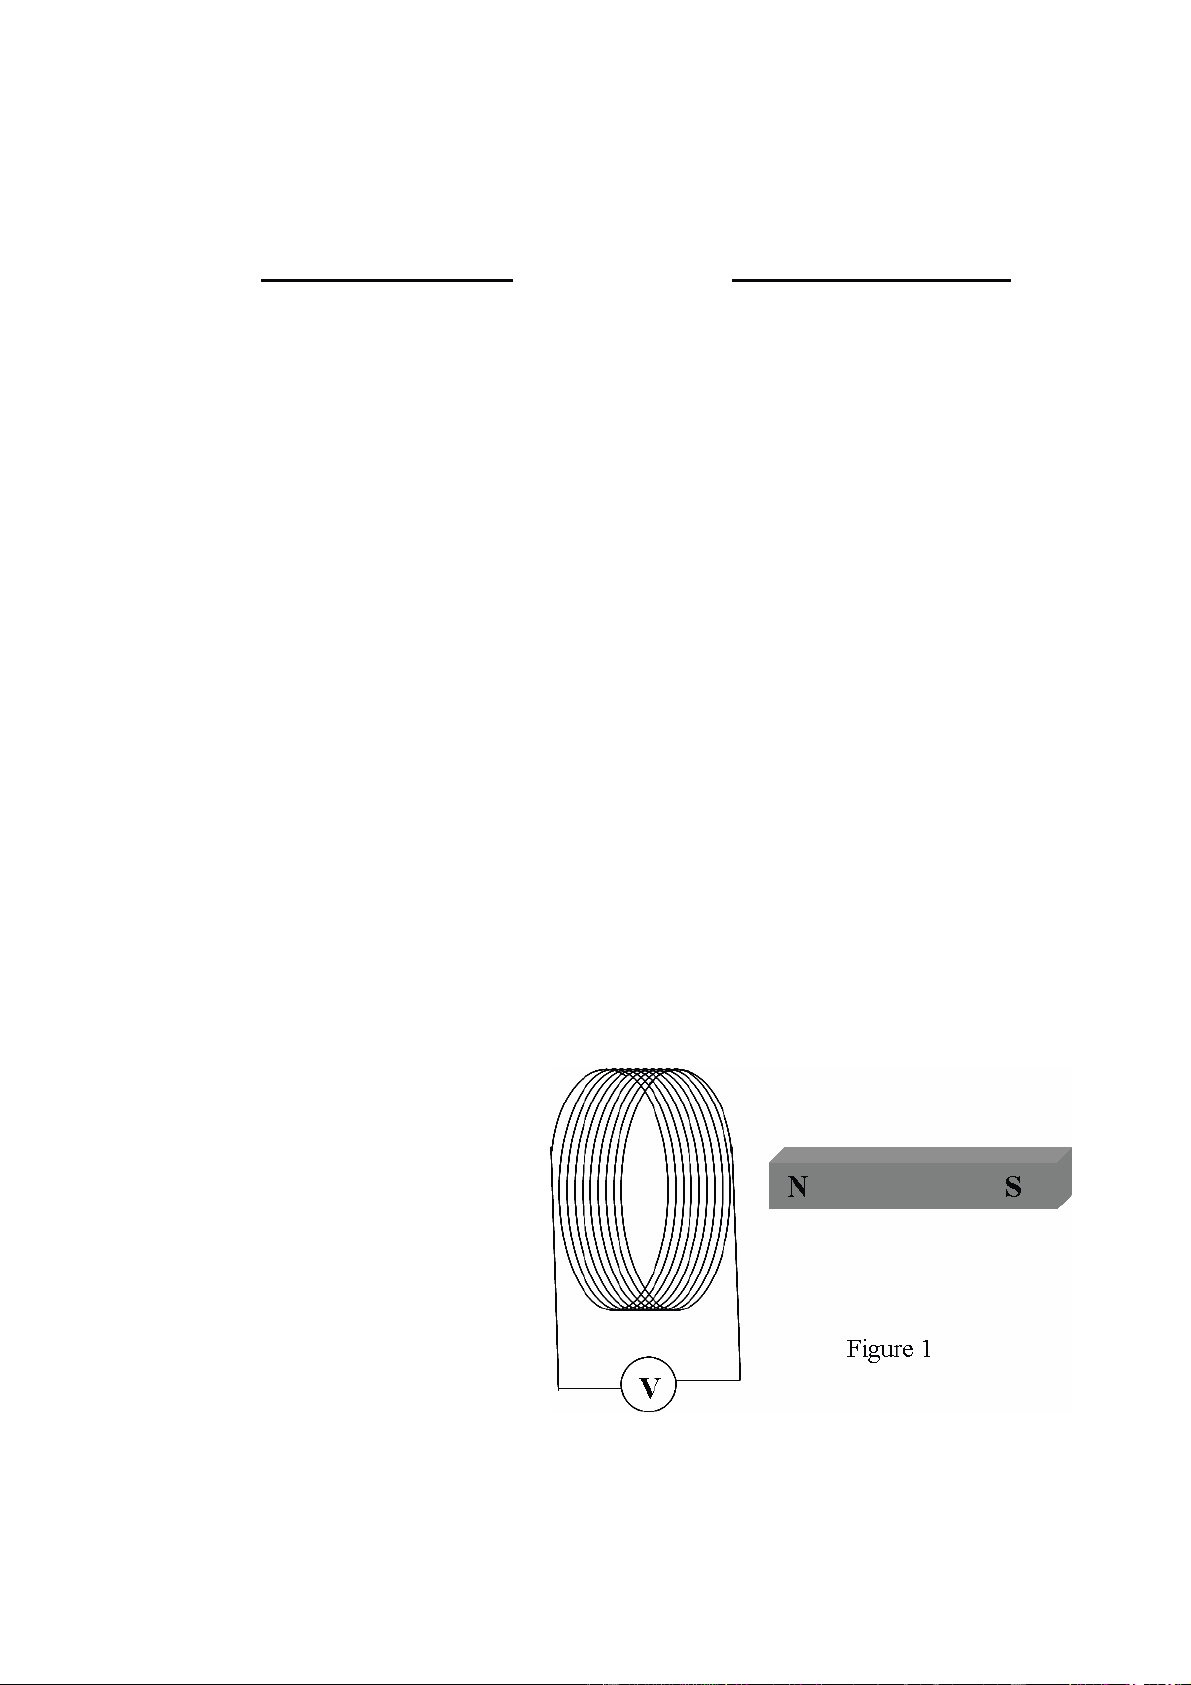
- As shown in Figure 1, you move a bar magnet through a coil. When the bar magnet enters the coil from the right side, the voltmeter reads a positive voltage. (a) When the bar magnet leaves the coil to the left side, does the voltmeter read a positive or negative voltage?
(b) If you move the bar magnet out of the coil and back to the right side, does the voltmeter read a positive or negative voltage?
(c) If you move the bar magnet into the coil much faster, what happens to the magnitude of the induced voltage inside the coil?
Faraday’s Law
PHYS 296/Spring 2007
Name_ _________ Lab section_______________ __
Lab partner’s name(s)_____ ______
Purpose In this lab, we will demonstrate Faraday’ law first qualitatively and then quantitatively.
Background
Early in the 19th century, Joseph Henry discovered that varying the magnetic field in a circuit induced current in the circuit. In 1831, unaware of Henry’s work, Michael Faraday independently and systematically conducted similar experiments using a coil and a bar magnet as shown in Figure 2a. As Faraday found, when the bar magnet was moved towards the coil, a current was induced in the circuit. Moving the bar magnet away from the coil induced an opposite current in the circuit. When repeating the experiment with the direction of the bar magnet reversed, the induced current also reversed the direction. Faraday also showed (Figure 2b) that when changing the current of a current-carrying solenoid – thus changing the magnetic field inside the solenoid – a current was induced in a second solenoid placed inside the first solenoid. Thus, Faraday discovered that a current can be induced in a circuit when the magnetic field in the circuit changes. Faraday’s work was summarized by James Clerk Maxwell, Faraday’s student, in the following equation known as Faraday’s law which relates the induced voltage in a solenoid, V , and the variation rate of the magnetic flux ( Φ (^) B ) through the solenoid
dt
d BdA N dt
d V N B A
Φ
r r , (1)
where N is the number of turns of the wire in the solenoid, B is the magnetic field, and dA
r is an infinitesimal area element on a surface bounded by the solenoid. For example, if B(t) is uniform inside the solenoid and points along the axial axis of the solenoid and if the cross sectional area of the solenoid is A, Equation (1) becomes:
dt
dB(t) V (t) = − NA.^ (1΄) Faraday’s law is the operation principle for many devices including generators, microphones, and magnetic tape reading head. A generalization of Faraday’s law is given by one of Maxwell’s equations. Fundamentally, it discloses that the magnetic field and the electric field are intrinsically related to each other. This is particularly clear in Einstein’s theory of special relativity.
- From what you observed in this experiment, describe a method for increasing the magnitude of the induced voltage.
(B) Inducing Voltage by Moving a Coil Relative to an
Stationary Magnet
PROCEDURES
Repeat steps 1-7 of the procedure of Part I (A), while this time keeping the magnet stationary and moving the coil back and forth.
QUESTIONS
- In the voltage-versus-time graph, correlate the varying voltage with the movement of the magnet relative to the coil and use Faraday’s law to explain the correlation.
- How can you increase the magnitude of the induced voltage in the coil?
- In terms of inducing voltage, i s there a difference between the two experiments? Explain.
PART II
In part II, we quantitatively investigate the effect of the varying magnetic flux through a solenoid (solenoid 2). Solenoid 2 is placed inside a big current-carrying solenoid (solenoid 1). Solenoid 1 produces magnetic field inside itself and thus also inside solenoid 2. When the current in solenoid 1 varies, the generated magnetic field inside solenoid 2 also varies. Thus, it produces a varying magnetic flux through solenoid 2 and accordingly induces a voltage in solenoid B. The magnetic field inside solenoid 1 is given by the following equation B = μ n (^) 1 I 1 = μγ μ 0 n 1 I 1 , (2)
where n 1 is the number of turns per unit length of the solenoid, I 1 is the current in solenoid 1, μ is
the permeability of the core material inside solenoid 1, μ r is the relative permeability for the core
material, and μ 0 is the permeability of free space. In this experiment, solenoid 1 is placed in air.
We can use μ r ≈ 1 for the air and thus
B = μ 0 n 1 I 1. (3)
When the current through solenoid 1 is driven by an AC voltage, I 1 is described by
I 1 (t) = I 0 sin( ω t ) , (4)
where I 0 is the amplitude and ω is the angular frequency. The induced voltage in solenoid 2 (which is placed inside solenoid 1) can be derived using Faraday’s law and it is,
V 2 (t) = − μ 0 N 2 S 2 n 1 ω I 0 cos( ω t ) , (5)
where A 2 is the cross sectional area of solenoid 2 and N 2 is the total number of turns of wire in solenoid 2.
(A) The Phase Difference between the Induced Voltage and
the Driven Current Inspecting Equations (4) and (5), it is obvious that the current in coil 1, I 1 (t) , and the induced voltage in solenoid 2, V 2 (t) , are out of phase. The phase difference can be measured by displaying I 1 (t) and V 2 (t) using Scope display in Data studio. Oscilloscope is a standard electronics instrument. It can display “real-time” graphs of voltage-versus-time or voltage-versus-voltage (in “X-Y” mode). The vertical and horizontal axes of an oscilloscope can be rescaled independently while data are being displayed. Once triggered, an oscilloscope can continuously update the measurement by constantly refreshing graphs. Owing to its working mechanism based on deflecting electrons by voltage, an oscilloscope displays only voltage. Scope Display in Data studio is program that emulates the oscilloscope and can simultaneously display up to three “real-time” traces.
PROCEDURES
- Connect solenoid 1 to Output Channel of 7500 Interface.
- Connect the Current Sensor to Input Channel A of 7500 Interface and connect solenoid 1 also to Current Sensor. Connect Voltage Sensor to Input Channel B of 7500 Interface and connect solenoid 2 to Voltage Sensor.
- In Data Studio , select Voltage sensor from the sensor window for Channel B. Select Current sensor for Channel A. Select volt for both sensors. Here, because that Scope Display only displays voltage, we select volt (instead of ampere) for the current sensor. In so doing, the current sensor sends a voltage signal developed across a 1 Ω -resistor to the interface.
(B) The Induced Voltage versus Frequency In Part II (B), we verify the linear proportionality between the amplitude of V 2 (t) and the modulation frequency ( ω = 2πf ).
PROCEDURES
Repeat steps 1-7 of the procedure of Part II (A) for the AC output at f = 1, 10, and 30 Hz. Print out the I 1 (t) and V 2 (t) traces for each case and label the print-outs with the corresponding f.
QUESTIONS
- Analyze the four sets of data (one from Part II (A)) and discuss whether the amplitude of V 2 (t) is linearly proportional to f.
- Calculate the ratio between the amplitude of V 2 (t) and ω. Show your derivation.
(C) The Induced Voltage versus the Number-of-Turns
In Part II (C), we study the linear proportionality between the induced voltage and the number of turns of wire in solenoid 2.
PROCEDURES
- Follow steps 1-7 of the procedure of Part II (A) and set f at 20 Hz.
- Acquire the V 2 (t) traces for three different lengths (3/4, 1/2, 1/4) of solenoid B. For each case, reconnect the solenoid 2 to Voltage Sensor appropriately.
QUESTIONS
- Analyze the four sets of data (one from Part II (A)) and discuss whether the amplitude of V 2 (t) is linearly proportional to the corresponding length of solenoid 2 that is connected for the voltage measurement.
(D) The Induced Voltage versus the Permeability
In Part II (C), we investigate the effect of inserting an iron bar (a ferromagnetic material) inside solenoid 2. The permeability of the iron bar is different from that of the air. Thus, we
cannot use μ 0 in this case.
PROCEDURES
Set the AC output at 20 Hz and repeat steps 1-7 of the procedure of Part II (A). Acquire and print out of the V 2 (t) traces with and without the iron bar inside solenoid 2.
QUESTIONS
- Does V 2 (t) increase or decrease when the iron bar is inserted inside solenoid 2? Why?
- Derive the relative permeability of the iron bar inserted in solenoid 2.
- E xplain why we use ferromagnetic materials as the core for transformers.