Download Debugging with CodeView, Visual Studio, Windbag - Computer Organization | CS 308 and more Study Guides, Projects, Research Computer Architecture and Organization in PDF only on Docsity!
CS
Debugging with CodeView, Visual Studio, WinDbg
Debuggers are extremely useful tools to help you uncover errors in your program. There are different debuggers that come with MASM:
Real mode debugger: CodeView Protected mode debugger: Visual Studio or WinDbg
Let’s start by taking a closer look at using CodeView. Microsoft CodeView is the debugger that comes with MASM.
If you have followed the instructions to install MASM, you should already have CodeView set up as the debugger for 16 bit programs through the T)ools menu on TextPad. If you want to debug a program named “myfile.asm” directly from DOS then first assemble it and you can debug it using codeview by typing “ cv myfile ” (without the asm) in the same directory as the source files.
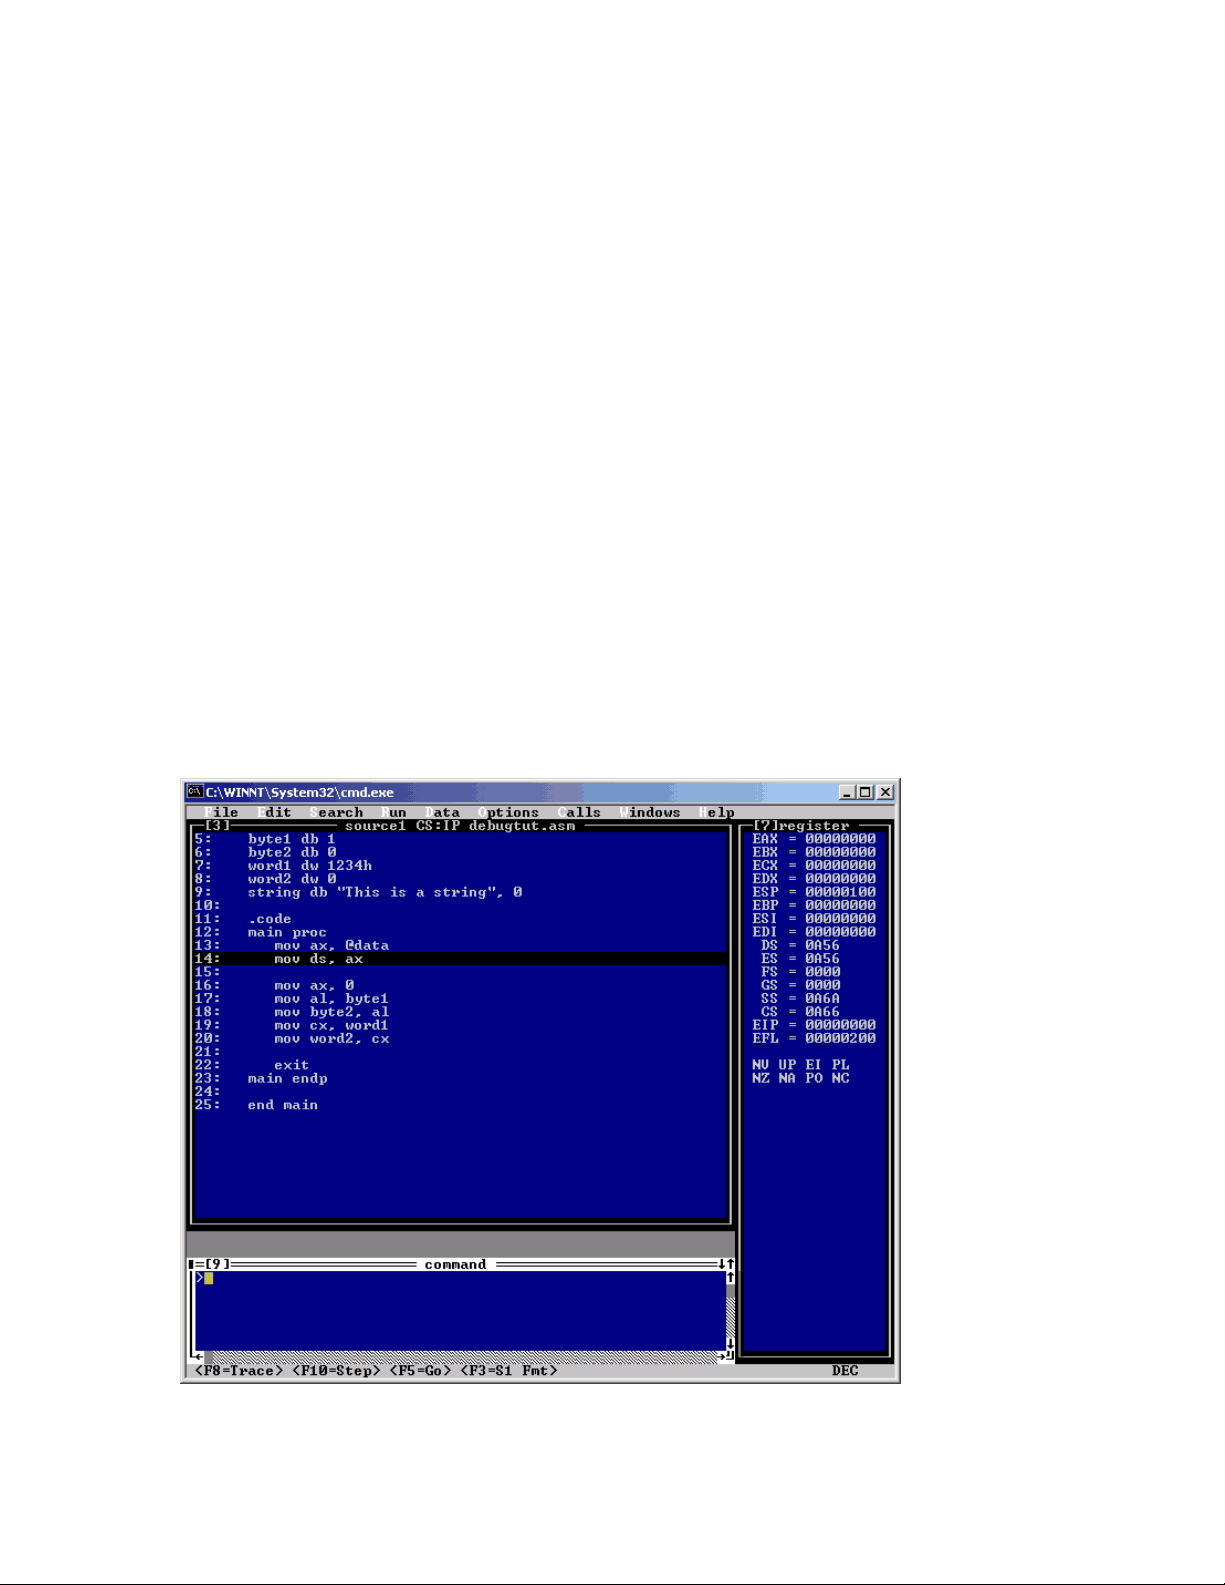
First, assemble the program and then invoke the debugger from TextPad. You should be shown with a window that appears something like that below. You may have additional windows. You can close or resize them as you wish, and open new ones from the W)indows menu.
I find it most useful to have the registers, source, and command windows available. You can type commands into the command window or you can also invoke most commands by selecting them from the menu bar.
I also find it helpful to put the window into full-screen mode (alt- Enter). If you wish to use graphical mode and want to use the mouse to resize windows, you may need to right- click the window, go to properties, and make sure that Insert and Quick-Edit modes are disabled.
Here is a sample program we will use to illustrate the CodeView debugger:
Title CodeView Tutorial Example INCLUDE Irvine16.inc
.data byte1 db 1 byte2 db 0 word1 dw 1234h word2 dw 0 string db "This is a string", 0
.code dummy proc mov bx, 0FFFFh ret dummy endp
main proc mov ax, @data mov ds, ax
mov ax, 0 mov al, byte mov byte2, al call dummy mov cx, word mov word2, cx exit main endp
end main
Some of the most commonly used commands are:
F5 – Execute program to the end F8 – Step one line, go into procedure calls F10 – Step one line, but go over procedure calls F9 – Set or Clear a breakpoint on the cursor line
For the sample program, try:
- Select O)ptions, S)ource and experiment with cha nging the view from source to mixed to machine.
- Display the registers window and resize it on the right.
- Examine variables using the? and da commands
- Trace the program and note changes in the registers and variables using the? commands.
- Restart the program which will reset the IP to the beginning of the program.
- From the Data menu, add byte2 and word2 as watch expressions. Re-trace the program and you should see these variables change. This is very useful for checking on programs that accidentally overwrite variables.
- Add string variables to the watch using the w? &string commands. Note that if you use the menu, you don’t get the specify the format, so strings don’t come out quite right in the watch menu.
- Add a breakpoint, restart the program, and illustrate that the program will stop execution at the breakpoint.
Debugging with Visual Studio
For protected mode programs, you can use the Visual Studio debugger if Visual Studio is installed on your system. Let’s step through the basic features of the Visual Studio debugger using the following sample program:
Title Protected Mode Tutorial Example INCLUDE Irvine32.inc
.data byte1 db 1 byte2 db 0 word1 dw 1234h word2 dw 0 string db "This is a string", 0
.code dummy proc mov bx, 0FFFFh ret dummy endp
main proc mov ax, 0 mov al, byte mov byte2, al call dummy mov cx, word mov word2, cx exit main endp
end main
First, build the program. Then, select the debugging option from TextPad. This will launch Visual Studio and bring up an empty screen that should look somewhat like the following:
Not a very helpful screen. But if you press F11, or select B)uild, Start D)ebug, S)tep Into, then this will start the debugger and allow you to step through the program:
The debugger will show your code and stop at the first line:
breakpoint will be visible with a red dot. In this example, I set a breakpoint inside the dummy procedure:
If I run the code by hitting F5 or selecting “Go”
Then the program will halt when execution reaches this line of code:
This is indicated by the yellow arrow over the red breakpoint. At this point, you are free to inspect variables in the procedure, step through the code line by line, etc. To remove a breakpoint right-click it again or click on the Hand icon to toggle the breakpoint.
When you are through debugging, simply close Visual Studio. The program may ask if you wish to save any project information – select no unless for some reason you wish to resume this debugging session at another time. You can then continue editing your program in TextPad. If you wish to make any changes to your program in TextPad, you must make sure that any debugging sessions are closed before rebuilding your program.
There are many other options available within Visual Studio. I encourage you to explore them on your own. The other debug windows are visible from the V)iew, D)ebug Windows menu:
Debugging with WinDbg
For protected mode programs, you can use the WinDbg program, which is freely available from Microsoft. See the web page installation instructions for how to download and install WinDbg with TextPad.
Assuming that you have WinDbg installed, let’s step through its basic features. WinDbg operates in a manner similar to Visual Studio’s debugger.
A tutorial on using WinDbg written by the author of your textbook is also available online at http://www.nuvisionmiami.com/books/asm/debug/windbg/index.htm
Let’s step through WinDbg using the same sample program we had for Visual Studio:
Title Protected Mode Tutorial Example INCLUDE Irvine32.inc
.data byte1 db 1 byte2 db 0 word1 dw 1234h word2 dw 0 string db "This is a string", 0
.code dummy proc mov bx, 0FFFFh ret dummy endp
main proc INT 3 mov ax, 0 mov al, byte mov byte2, al call dummy mov cx, word mov word2, cx exit main endp
end main
You will notice one significant difference. The line INT 3 must be added as the first line in the program. This is specific to the way WinDbg works. The instruction forces your program to halt and transfer control to the debugger.
Next, build the program. Then, select the debugging option from TextPad. This will launch WinDbg and bring up an empty screen that should look somewhat like the following:
To step through the program, use: F10 - step to next instruction, but over any procedures F11 - step to next instruction, but inside any procedures
Alternately you can use the menu or hit the icons:
The icons represent stepping into, stepping over, stepping out of, or running to the cursor location.
To view the contents of registers, bring up the registers window. This is available from the V)iew menu:
As you can see, there are several other windows available to view. We’ll only talk about the Registers and the Watch window. Upon selecting the registers window, a window will appear with the contents of each register:
The list of registers may be much longer than what we have discussed in class. That is because this list also contains floating point and MMX/SSE registers that are available on more recent processors. As you step through the program, the registers that have changed value will be updated in red in this window.
To view the contents of variables, use the Watch window, also available from the main menu under V)iew. Enter the name of the variable you are interested in, and its contents will be displayed. To view strings, use an & in front of the string just as with Visual Studio. In the example below, we are looking at the contents of byte1, word1, and string:
To set a breakpoint, click the hand icon on the line that you want execution to stop. The line will turn red. In the picture below, I have set a breakpoint in the beginning of the dummy procedure:
Run the program by hitting F5 or selecting “Go” from the Debug menu: