

Study with the several resources on Docsity

Earn points by helping other students or get them with a premium plan


Prepare for your exams
Study with the several resources on Docsity

Earn points to download
Earn points by helping other students or get them with a premium plan
Community
Ask the community for help and clear up your study doubts
Discover the best universities in your country according to Docsity users
Free resources
Download our free guides on studying techniques, anxiety management strategies, and thesis advice from Docsity tutors
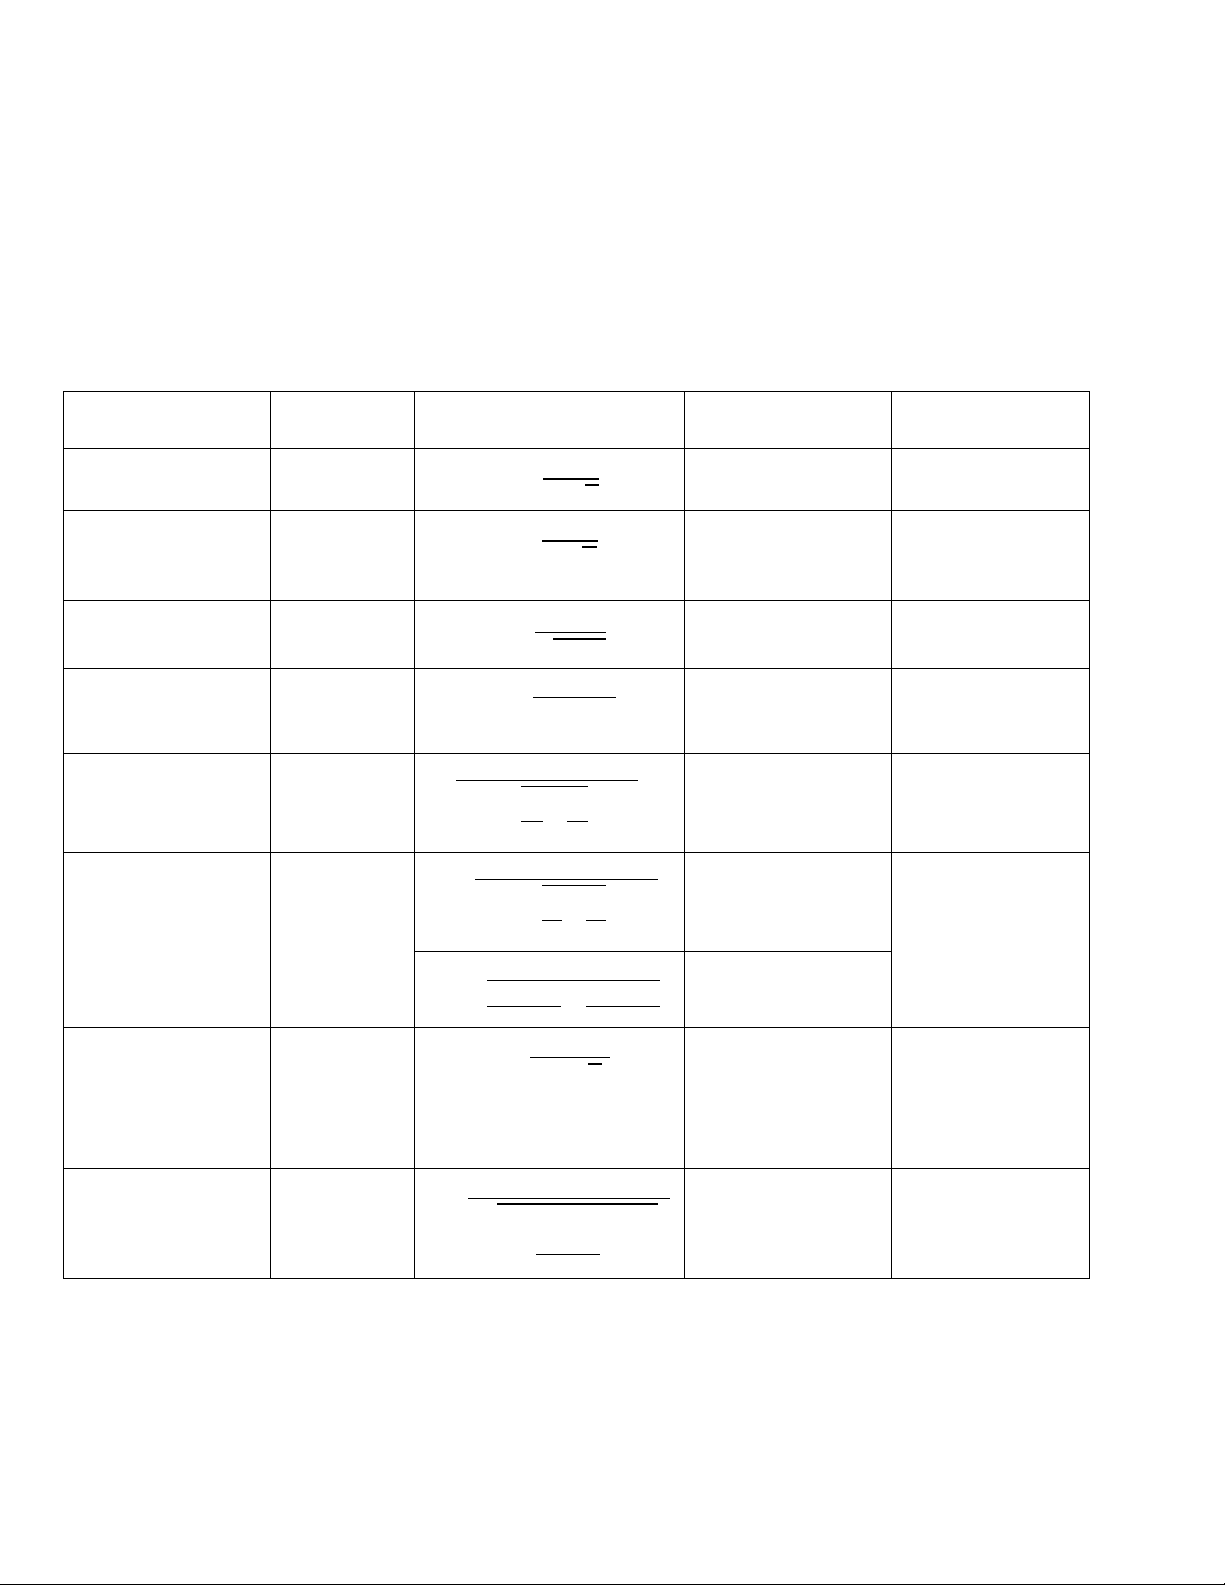
Cheat Sheet for Hypothesis Tests, Cheat Sheet of Statistics
Statistics testing steps and table
Typology: Cheat Sheet
1 / 1

This page cannot be seen from the preview
Don't miss anything!

Related documents
Partial preview of the text
Download Cheat Sheet for Hypothesis Tests and more Cheat Sheet Statistics in PDF only on Docsity!
Cheat Sheet for Hypothesis Tests
Steps:
- State null and alternate hypotheses (Ho includes the equal sign, Ha does not)
- State the significance level,
- Determine the critical value (use the appropriate table)
- Determine the Test Statistic (use table below for the correct formula)
- Sketch distribution and mark the rejection regions and test statistic
- Make a decision (if z, t, is in the rejection region, reject Ho. Otherwise fail to reject Ho)
- Interpret the decision in the context of the original claim.
Test for Sample Statistic
Test Statistic Rejection region p-value
Use When
One population mean, ̅
Z-Test is known
One population mean, ̅
T-Test is unknown
One population proportion, p ̂
1-PropZTest ̂ ̂
One population standard deviation,
( ) (^) Test X is normal
Difference of two population means ( )
̅ ̅^ (^ ̅ ̅)^ (^ )
√
2-SampZTest are known
Difference of two population means ( )
̅ ̅^ (^ ̅ ̅)^ (^ )
√
2-SampTest are unknown
( ) ( ) ( )
Difference between two means (dependent samples)
TTest are unknown
Difference of two proportions ( )
( ̂ ̂) ( ) √ ̅ ̅( ) ̅
2-PropZtest ̂ ̂ ̂ ̂

